
The Search Brief · News analysis
Google Adds Multimodal Search Reporting: What the September Update Changes for SEO
Google adds multimodal reporting to Search Console. Examine the September update, useful image evidence and a practical plan for measuring visual discovery.
Development covered: September 24, 2026
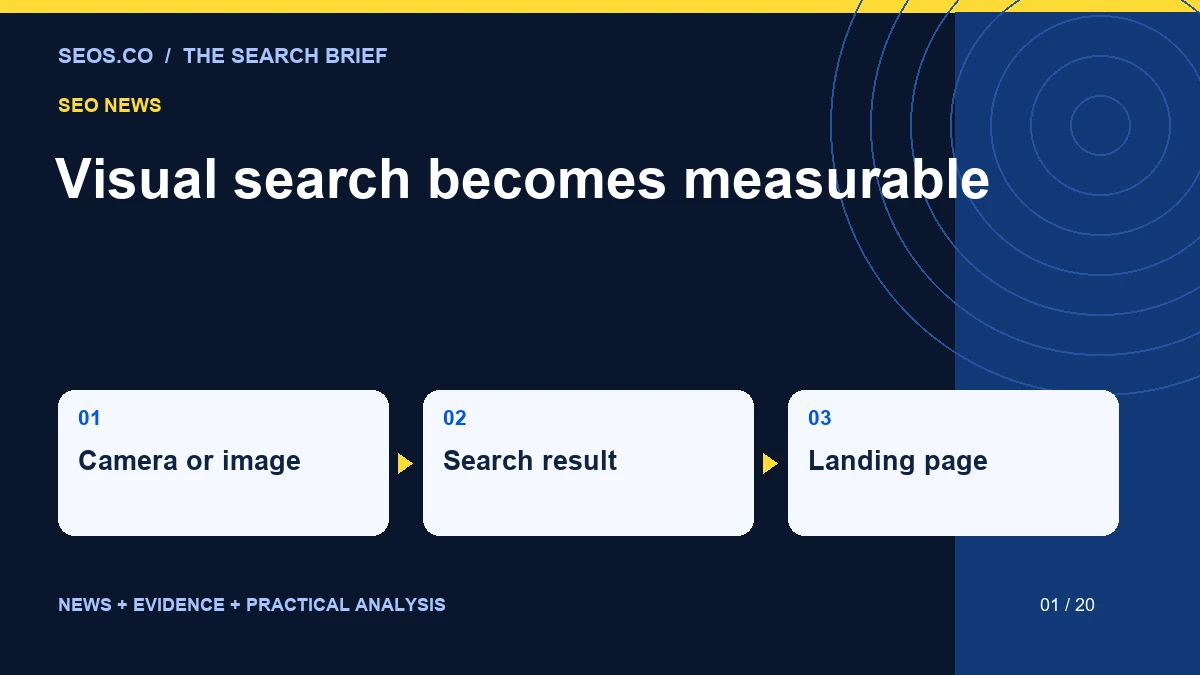
Google’s latest Search Console release gives visual discovery a more visible place in the SEO reporting conversation. For businesses that invest in product photography, diagrams, location images or instructional content, the immediate opportunity is to understand which assets help someone move from seeing an object to finding a useful page. The harder question is whether that discovery produces a valuable visit.
In its September 24 announcement, Google introduced multimodal search reporting in the Search results and generative AI performance reports. The company says the coverage includes Lens, Circle to Search, image uploads and Chrome’s image-search interaction. A new search-type filter provides access, with global rollout beginning that day. Sites will see the relevant metrics when they receive activity from those searches. Those are reporting changes; the announcement does not establish a new ranking formula.
Our assessment is that the release should change how teams discuss image investment. A photograph can be a discovery asset, a product explanation and a conversion aid at the same time. Treating every image as a decorative file with an alt attribute misses those separate jobs. Equally, a new reporting view should not trigger an indiscriminate campaign to replace working images or publish hundreds of near-identical visual landing pages.
The most useful question starts with the visitor
Consider someone who photographs a damaged fitting beneath a sink. That person may not know the product’s name, its dimensions or which replacement will fit. The useful destination is a page that helps identify the fitting, explains compatibility and offers a credible next step. A beautiful stock photograph of a plumber contributes little to that specific problem. A labeled comparison of fittings could contribute much more.
The same reasoning applies to retail, travel and services. A shopper may recognize a chair’s silhouette but not its manufacturer. A traveler may recognize a building while knowing nothing about its opening hours. A homeowner may recognize a type of roof damage without knowing whether it needs urgent attention. The image begins the investigation; the destination must finish enough of it to justify the visit.
That distinction gives an editorial team a practical commissioning brief. Instead of asking for “SEO images,” ask which identification, comparison or verification task the image supports. Record the question a visitor could bring, the uncertainty the picture resolves and the information that must remain in readable text. This makes visual work accountable to a user need before any traffic data arrives.
A measurement plan that survives the first exciting screenshot
A newly available reporting segment often creates a burst of enthusiasm followed by an ambiguous spreadsheet. The first chart goes up, somebody credits the latest image changes, and the team discovers several weeks later that the comparison periods were different lengths. Avoiding that outcome requires a written baseline, even if it is initially small.
We would start with a fixed inventory of important landing pages and their principal visual assets. For each page, record its commercial purpose, intended audience, existing traffic pattern and the date of the last meaningful visual change. The inventory should distinguish a product detail page from an inspiration article, a category page and a location page. Those destinations have different reasons to exist and different definitions of a successful visit.
Use comparable reporting periods and retain the export date. A launch week is particularly vulnerable to partial rollout, incomplete processing and unusually high curiosity. Do not interpret an empty view as proof that images are unusable or that a site has been excluded. Equally, a handful of impressions is not evidence that a complete visual strategy has worked. Early reporting is best used to establish what can be measured consistently.
The business outcome belongs in a separate column. A visitor who checks a compatibility table and leaves may have received a useful answer, while a visitor who submits an irrelevant inquiry may create cost rather than value. For commercial reporting, define the desired action in advance: a suitable product purchase, an appointment request, a qualified quote or a meaningful engagement with a decision tool.
Why landing-page quality matters as much as the image
Visual discovery can expose a mismatch between what a page appears to offer and what it actually contains. A close-up of a particular product variation might lead to a page that only describes the overall range. A labeled diagram might lead to a page where the important label has been flattened into a tiny image and never explained. In both cases, the acquisition asset promises more precision than the destination delivers.
The correction is usually concrete. Put the identification details beside the image. Name the model or variation when it is known. Explain measurements, materials, limitations and compatibility in text. Make the next action visible without requiring a visitor to search through unrelated promotional sections. Where the information is uncertain, say what additional detail is needed rather than pretending the photograph settles the issue.
For service businesses, use images that document real capabilities or help customers understand a process. A before-and-after comparison needs consistent framing and honest context. A facility photograph should reflect the actual location. A process diagram should distinguish an illustrative sequence from a guaranteed customer outcome. These decisions improve the usefulness of the page independently of any particular search feature.
An original example: deciding which image project to fund
Imagine a specialty retailer with three proposed projects and a budget that will fund only one this month. The first proposal replaces twenty existing product photographs with larger versions. The second adds a comparison diagram showing which components fit together. The third creates a lifestyle gallery featuring products already represented elsewhere on the site. None is automatically the best SEO investment.
The retailer could assess each proposal against four questions: does it resolve a documented customer uncertainty, does it support an important landing page, can the resulting behavior be measured, and is the information difficult to communicate with existing assets? The comparison diagram might win if support tickets repeatedly concern compatibility. The photograph upgrade might win if small details determine product selection. The lifestyle gallery might win if customers struggle to understand scale or placement.
This is a hypothetical prioritization exercise, not a reported experiment. Its purpose is to make the cost of visual production visible. A team should be able to explain why an asset deserves investment before claiming that a platform’s new reporting feature will reward it. Search data can later refine the decision, but it cannot substitute for knowing what customers are trying to accomplish.
| Proposed asset | Customer question | Evidence to examine | Useful outcome |
|---|---|---|---|
| Product detail photograph | Is this the correct variation? | Returns and product questions | Fewer unsuitable purchases |
| Compatibility diagram | Will these parts work together? | Support requests and comparison use | More confident selection |
| Location image | Is this the place I need? | Directions and location inquiries | Relevant visits or bookings |
| Process illustration | What happens next? | Abandonment and sales objections | Better-qualified inquiries |
Image optimization needs an editorial handoff
The person preparing an image often has information that never reaches the publishing team: what the photo shows, which variation is pictured, whether the image is illustrative and whether usage rights are limited. Losing those details makes accurate captions and alternative text harder. A stronger handoff includes the asset’s purpose, subject, source, ownership and relevant factual context.
File names should help the team manage assets without creating unnecessary migration work. A descriptive name for a new upload is sensible. Renaming an established file solely to insert another keyword can introduce broken references, duplicate files and maintenance costs. Evaluate the actual problem before making a change. The most important asset-management outcome is that the correct image remains available on the correct page.
Alternative text should reflect the image’s function in its context. If a diagram communicates a process, the surrounding copy should also explain that process. If a photograph is purely decorative, it should not carry a forced sales phrase disguised as accessibility text. A keyword quota is a poor substitute for describing what a person needs to understand.
Performance belongs in the same handoff. A large visual should be appropriately sized, delivered efficiently and given stable dimensions so the page does not jump as it loads. The team should check the actual published page on a narrow screen, including the caption and any zoom behavior. An asset that looks excellent in a design file can become unreadable after a content-management system crops it.
What to separate in the reporting conversation
One common mistake is to treat all image-related discovery as a single channel. Another is to combine visibility metrics from different experiences into one number and call it audience growth. The safer approach is to preserve the labels and definitions supplied by each report, then explain how the measurements relate to the business question.
For example, a team investigating an improvement in product sales should ask whether the relevant landing pages received more suitable visitors, whether product availability changed and whether another campaign ran at the same time. It should also check whether the product mix shifted toward higher-priced items. An increase in revenue can be real while the proposed explanation for that increase is wrong.
A team investigating awareness has a different task. It may be looking for broader exposure of an image library, coverage across more products or discovery in additional markets. Those outcomes can be useful without immediately producing sales. The report should say that it is measuring discovery rather than quietly translating every appearance into a commercial success.
The agency brief should become more specific
Businesses buying SEO services can use this update to ask more useful questions. Request an asset-level inventory, a landing-page plan and an explanation of which visual problems the agency expects to solve. Ask how it will distinguish an original photograph, an illustrative graphic and a product image supplied by a manufacturer. Ask who checks accuracy and who owns the final files.
The proposal should also explain measurement limits. A credible agency can describe an experiment without promising that a specific image will appear in a specific search experience. It can document the starting condition, the change, the observation window and the business outcome it intends to evaluate. That is more useful than a package that promises “multimodal dominance” without defining what will be delivered.
For readers comparing providers, our SEO agency directory can help organize a shortlist. The important next step is to examine whether a provider has relevant visual-content, technical implementation and analytics capabilities. A company that writes excellent articles may still need a specialist partner for product photography or complex interactive diagrams.
A disciplined first month
During the first week, establish the reporting baseline and identify a manageable group of pages. Choose pages with a clear customer task and a real visual weakness. Avoid selecting only pages that already perform exceptionally well, because that makes the results harder to generalize. Keep a record of which pages are unchanged so the team has some context for wider demand movements.
In the second week, improve a small number of assets and their accompanying explanations. During the remaining weeks, verify that the published pages display correctly and collect observations without continuously changing the experiment. If several unrelated elements must change for business reasons, record them. The aim is not laboratory perfection; it is an honest account of what happened.
At the end of the period, report the practical findings. Perhaps users engaged with a comparison diagram but the traffic sample was too small to assess acquisition. Perhaps the new photography reduced support questions without changing search visibility. Perhaps nothing measurable happened. Each finding can inform the next investment if the team resisted the temptation to describe every change as a ranking success.
The broader implication
One final quality check is worth assigning to someone who did not prepare the asset. Give that person the customer question and ask whether the image and page together answer it. Can they identify the relevant variation? Can they read the important labels on a phone? Can they distinguish a photograph of the actual product from a conceptual illustration? Their observations can reveal practical problems that a metadata checklist will never catch.
Record the result beside the asset in the inventory. A short note explaining that the diagram answers a compatibility question is more useful for future editors than a green indicator saying the image is “optimized.” It preserves the reasoning behind the work and makes later updates less likely to remove the very detail that made the page helpful.
The reporting release makes visual discovery easier to discuss with evidence, but it does not make every business a visual publisher overnight. The opportunity is greatest where customers already use appearance, shape, location or physical detail to make decisions. In those situations, visual content can carry information that a generic paragraph cannot.
The right response is therefore selective and practical: identify the visual questions your customers bring, give those questions useful destinations, and measure the resulting behavior carefully. Google’s new view provides another observation point. The enduring work is to make the image and the page worth finding.
Reporting note: This article distinguishes Google’s announced reporting functionality from SEOS.co’s analysis and hypothetical planning examples. It does not report an original traffic experiment or promise inclusion in a search feature.