
The Search Brief · News analysis
Google’s Generative AI Reports Are Now Global: How to Read Visibility Without Inventing ROI
Google’s generative AI reports are global. Understand what visibility metrics can establish, how to build a baseline and where revenue attribution remains uncertain.
Development covered: June 3, 2026; rollout update August 31, 2026
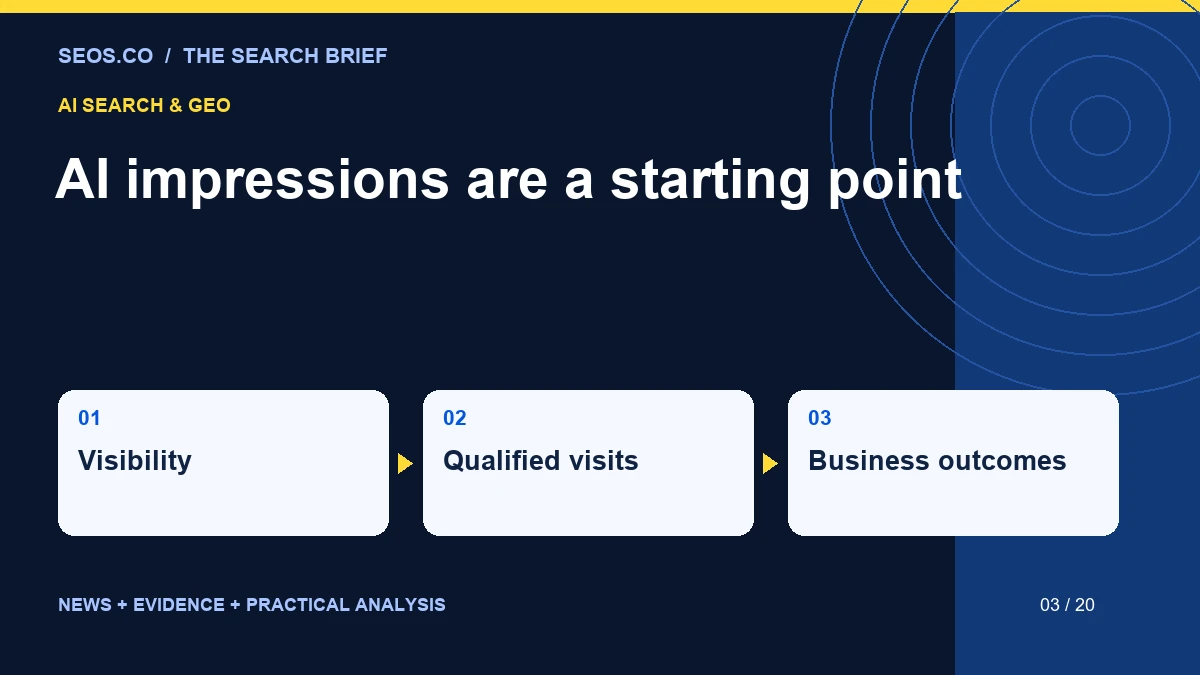
Google’s dedicated generative AI reporting has moved from a limited rollout to a broader part of the publisher measurement toolkit. That gives website owners a more direct starting point for discussing AI visibility, but it also creates an opportunity for a familiar reporting mistake: treating a newly visible number as a newly proven business result.
The Search Console announcement, first published June 3 and updated August 31, says the insights are now available to websites worldwide. Google describes dedicated views of impressions in generative AI features across Search and Discover, with page, country and date information, plus device information for Search. The company also says this activity remains included in overall performance reporting. The update is a measurement development, not evidence that any particular optimization caused additional visibility.
For an SEO team, the immediate task is to build a baseline that can survive scrutiny. Which pages appear? Are they relevant to the business? Does the pattern persist across comparable periods? What can the organization observe after discovery? Those questions are less dramatic than a headline about dominating AI, but they are more likely to produce a useful strategy.
A new report can expose an old attribution problem
Traditional search reporting already contains gaps between exposure, traffic and revenue. AI visibility introduces another observation point into that chain. A company may be used as a source for an answer without receiving a visit, or a prospective customer may encounter the brand and return through another route later. Both possibilities matter, but neither can be assigned a precise commercial value without supporting evidence.
The temptation is to fill the gap with an assumed multiplier: every impression is worth a certain number of visits, every mention implies a certain level of trust, or every cited page represents a recommendation. Those assumptions can make a presentation look complete while hiding the fact that the business outcome remains unknown. A stronger report preserves the unknowns and identifies the next measurement that could reduce them.
This is particularly important for service businesses. An informational explanation about a technical topic may be useful to many readers who will never hire the company. A smaller amount of exposure around a purchasing decision may be more relevant commercially. Raw visibility alone cannot determine which situation applies.
Begin with a page-level question
We would first group the pages by purpose. Separate educational explanations, commercial service pages, product information, comparison resources and support content. Then inspect whether the observed visibility matches the role each page is supposed to play. A support page appearing frequently may indicate a useful resource, an unresolved product problem or both.
The classification should be simple enough that another person can apply it consistently. Do not create dozens of categories that exist mainly to make the dashboard look sophisticated. Five or six meaningful page groups are often enough to reveal whether the visibility is concentrated in a commercially relevant part of the site or spread across peripheral material.
Once the groups exist, identify the pages whose accuracy matters most. If a page explains prices, eligibility, safety limitations or service availability, a stale statement can affect the quality of an AI-mediated discovery experience. The first content priority may therefore be correction rather than expansion. More impressions for an inaccurate page would be a maintenance problem, not a success.
The difference between a baseline and a claim
A baseline is a dated record of what a system reported under specified conditions. A causal claim says that a particular intervention changed an outcome. Moving from the first to the second requires more than placing an update date beside an upward line.
Suppose a company revises twelve articles, improves site navigation and launches a public relations campaign in the same month. AI visibility rises afterward. It is reasonable to report the increase and the concurrent work. It is not reasonable to identify the navigation change as the sole cause without additional evidence. Several changes, external demand and platform behavior may all contribute.
The practical solution is an experiment log. Record the affected pages, the change, the intended mechanism, the implementation date and other relevant activity. Where feasible, compare with similar unchanged pages. The comparison will rarely be perfect, but it gives the team a more disciplined way to interpret results than selecting whichever explanation best supports the latest invoice.
An example of a more honest executive summary
Imagine a hypothetical manufacturer whose troubleshooting pages receive more AI exposure during a month in which a product issue also becomes more widely discussed. A weak summary might celebrate an increase as proof of an AEO campaign. A stronger summary would explain that the affected pages address a topic with rising demand, that the content was updated and that the commercial effect is still being investigated.
The next questions would be operational. Are customers finding accurate instructions? Are support contacts becoming more specific? Are visitors reaching the correct product documentation? Has the company reduced confusion, or simply become more visible around a problem? Those questions connect content performance to the business without forcing every observation into a lead-generation narrative.
The example is deliberately hypothetical. It illustrates why an AI report should sit beside service and product information rather than being treated as a self-contained scorecard. A page can be highly visible for reasons that deserve attention from operations, customer support or legal review as well as marketing.
Keep the denominator visible
Percentages are attractive because they make different-sized sites appear comparable. They can also disguise small samples. An increase from a very small baseline can produce an impressive growth rate while representing little additional exposure. A decline in a large, important page group can be hidden by rapid growth in a small experimental section.
Show absolute figures alongside percentage changes, and identify the observation window. If a report covers only part of a month, label it clearly. If some pages have too little activity to support a stable interpretation, group them sensibly or describe the result as preliminary. The purpose is to help a decision-maker understand scale, not to remove every inconvenient fluctuation.
A dashboard should also preserve the relationship between its segments. When a specialized view overlaps with a broader total, do not add them together as if they represented separate audiences. That simple arithmetic mistake can inflate a visibility story and make later comparisons difficult to reconcile.
A practical evidence ladder
For internal planning, we recommend an evidence ladder with five stages. The first is eligibility: the relevant page is available and technically suitable for discovery. The second is observed exposure. The third is a visit or other identifiable interaction. The fourth is a useful action. The fifth is a business outcome that meets the organization’s qualification criteria.
This is a proposed management framework, not a platform scoring system. A company may have strong evidence at one stage and weak evidence at another. That is normal. The value of the framework is that it prevents a report from quietly substituting an easier measurement for the outcome the business actually cares about.
| Stage | Example evidence | Appropriate interpretation |
|---|---|---|
| Eligibility | Accessible, current page | A necessary foundation |
| Exposure | Reported appearance | Visibility was observed |
| Interaction | Recorded visit or engagement | Someone took a next step |
| Useful action | Suitable inquiry or product action | The interaction had practical value |
| Business result | Qualified opportunity or completed sale | Commercial value can be assessed |
What to change on a page after reviewing the data
The report should generate a specific editorial question. If an explanation appears for an important topic, check whether it gives a complete and accurate answer. If a commercial page appears, check whether it describes the actual service, audience, limitations and next step. If several pages address the same need, examine whether they help the reader or create unnecessary ambiguity.
Changes should follow the problem. An unclear comparison may need a decision table. An unsupported claim may need evidence or removal. A dated instruction may need a correction. A page with weak navigation may need better connections to relevant resources. Adding a standard FAQ block to every page is not a substitute for identifying what the individual page is missing.
Our evergreen SEO guides provide background for readers who need to understand the underlying concepts. A news analysis like this serves a different role: interpreting a platform development and explaining how a team might respond. Keeping those roles separate helps avoid creating several pages that repeat the same introduction without adding value.
Why an AI visibility vendor needs a methods conversation
Commercial monitoring tools can add useful observations, especially when they preserve exact prompts, dates and response evidence. However, a third-party panel and a first-party report may observe different things. A vendor should explain the sample, the collection method, the geography, the platform surface and the definition of a citation or mention.
When the numbers disagree, investigate the definitions before declaring one source wrong. One dataset might count a brand name, another a linked source, and another an appearance within a particular product. These can all be legitimate observations while answering different questions. A reconciled methods note is often more valuable than another blended “AI authority” score.
Ask whether the vendor can provide the underlying examples for important movements. A sudden rise concentrated in one unusual prompt deserves a different response from a broad, persistent change across relevant purchasing questions. The ability to inspect evidence is essential when the report will influence spending or editorial priorities.
Set a review rhythm that matches the uncertainty
Daily observation can help detect technical failures, but it is a poor basis for repeatedly rewriting content in response to small fluctuations. Establish a reasonable review period and separate urgent corrections from performance experiments. If a page contains an incorrect price or broken form, fix it promptly. If a citation count moves slightly, gather context before making another large change.
At each review, document what changed in the site, the business and the measurement system. A new product, a seasonal event or a reporting update can alter the interpretation. Keeping a short narrative alongside the chart makes the analysis more robust when somebody revisits it several months later.
The reporting owner should also be responsible for retiring unsupported conclusions. If an early hypothesis does not hold up, revise it. A mature measurement program is allowed to learn. Its credibility depends more on how it handles contrary evidence than on how confidently it describes the first positive result.
The questions worth bringing to the next meeting
Before expanding an AI optimization budget, ask which audience questions the company wants to be useful for, which pages currently support those questions and what evidence would justify further investment. Then ask what the report can establish today and what remains unobserved. Those questions connect visibility work to a deliberate business strategy.
Also ask whether the proposed work improves the underlying resource for a human reader. Clear evidence, accurate explanations, usable comparisons and current details are valuable even when a particular platform does not cite the page. That gives the investment a more durable foundation than an effort focused entirely on manipulating one uncertain reporting signal.
Google’s broader rollout is welcome because it gives publishers another source of direct observation. The opportunity now is to use that observation carefully. A good report should make the organization more precise about what it knows, more curious about what it does not know and more selective about what it changes next.
Keep the reporting process usable after the launch
A measurement program also needs an owner. Someone should be responsible for preserving exports, recording definition changes and explaining discrepancies between reporting systems. Without that responsibility, a promising new dashboard can become another screenshot in a monthly presentation, detached from the decisions it was supposed to improve.
Choose a review cadence that matches the amount of data. A small site with occasional observations may learn little from daily fluctuations. A larger site may need more frequent monitoring to identify a broken template or an unexpected change in coverage. The cadence should serve a question, rather than create an obligation to comment on noise.
Retain a short decision log beside the figures. Record which page was changed, why it was selected, what outcome would count as useful evidence and when the team will review it. If the result is inconclusive, say so and identify the next observation that could resolve the uncertainty. This makes a new reporting surface part of a learning process rather than a source of increasingly elaborate but untestable claims.
Reporting note: Platform functionality is attributed to Google’s announcement. The evidence ladder, experiment process and manufacturer scenario are SEOS.co analysis. No revenue lift, ranking improvement or causal optimization result is claimed.