
The Search Brief · News analysis
Ahrefs Changes AI Demand Reporting: Why ‘AI Adjusted Volume’ Needs a Different Forecast
Ahrefs explains AI Adjusted Volume. Learn how the estimate differs from a prompt count and how to use scenarios when planning AI search content investments.
Development covered: August 17, 2026
AI visibility planning has a demand problem: marketers want to know which topics matter, but conversational prompts do not behave like a tidy list of identical search queries. Ahrefs’ August explanation of AI Adjusted Volume offers a new estimation approach—and a useful reminder that a modeled number is not a direct count of conversations.
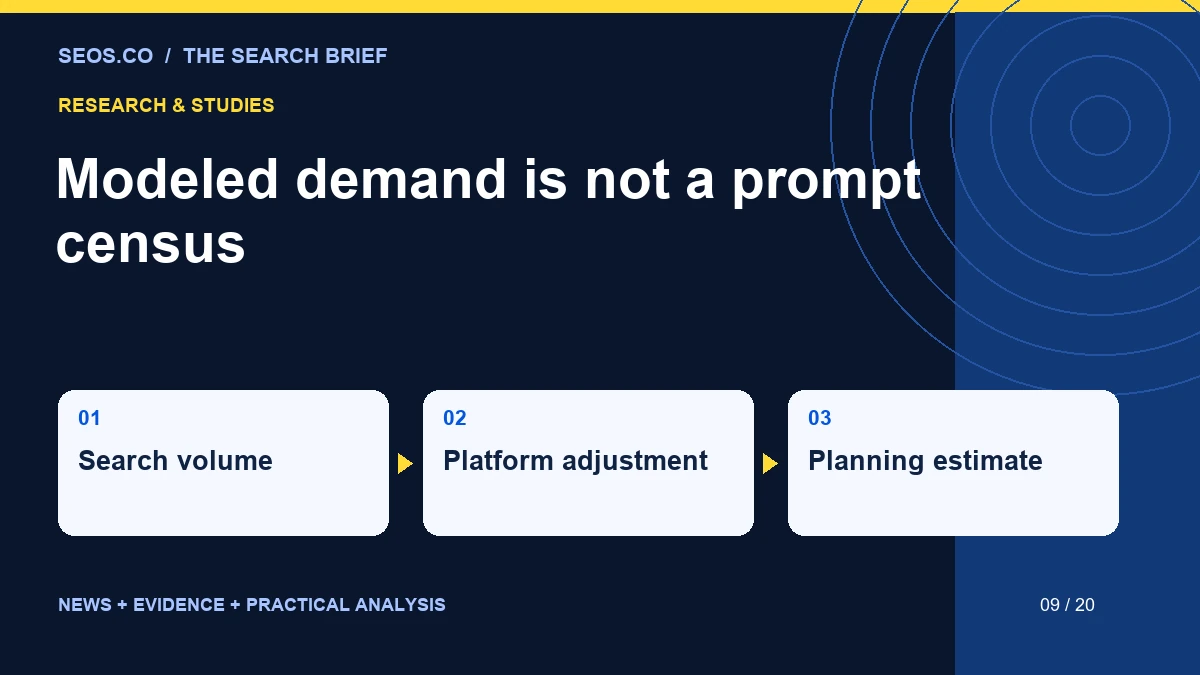
In its August 17 methodology article, Ahrefs describes an estimate built from the Google search volume of a prompt’s highest-volume parent keyword, adjusted by a platform-specific ratio derived from aggregate AI-referred traffic relative to Google organic traffic. The company said its temporary display of ordinary Google volume would end after August 31, with AI Adjusted Volume used thereafter. The method is a proxy for demand in an environment without a complete, directly observable prompt census. It should not be interpreted as the exact number of users asking an AI platform a particular question.
That distinction changes how an SEO or GEO team should use the metric. It can help organize research and compare opportunities under a consistent model. It cannot remove uncertainty from a traffic forecast simply because the interface presents a number.
Why conversational demand is harder to count
Two people can express the same commercial need in very different language. One asks for an agency for a regional healthcare business. Another describes a budget, a migration problem and three cities before requesting a shortlist. Their prompts may overlap in purpose while sharing few exact words.
Conversation adds another complication. A later question can depend on earlier context. “Which one is best for us?” is meaningful inside a discussion but nearly useless as an isolated keyword. Counting that sentence would reveal little about the underlying demand without knowing what preceded it.
Traditional keyword research also involves estimates and ambiguity, but conversational systems make the gap between wording and intent particularly visible. A useful planning method should therefore treat prompts as samples of tasks, not as a complete inventory of every sentence a customer might type.
This does not make demand analysis impossible. It changes the unit of work. Teams can organize opportunities around the decisions users are making, then use available estimates to help prioritize those decisions. The estimate is one input alongside commercial relevance, evidence availability and the quality of existing resources.
A modeled value needs a visible label
The most common reporting mistake is to drop the qualifier when a number moves from a tool into a spreadsheet. A column originally labeled as adjusted or estimated can become “monthly AI searches” in a presentation. The new label appears more concrete than the underlying method supports.
Preserve the source, definition and retrieval date next to the value. If the model changes, the reporting team should be able to identify a break in comparability. A rising number may reflect a revised estimation method rather than a sudden increase in real-world demand.
Do not combine values from different tools as if they shared a common measurement system. One may estimate prompts, another referrals and another observed mentions within a selected query set. They can all be useful while remaining fundamentally different.
A clear dashboard can show the estimate and a short methodology note without overwhelming the reader. The objective is to make uncertainty legible, not to bury the report in caveats. A decision-maker should know whether a number was counted, modeled or inferred.
Use sensitivity analysis instead of a single confident forecast
Consider a hypothetical planning exercise with a parent keyword volume of 10,000 and an assumed adjustment ratio of 0.02. Multiplication produces an illustrative adjusted value of 200. The ratio in this example is invented to explain the arithmetic; it is not an Ahrefs platform ratio or a forecast for a real topic.
If the assumed ratio were 0.01, the result would be 100. At 0.04, it would be 400. The difference is large enough to affect a business case. Displaying only 200 can hide how much the conclusion depends on the assumption.
A practical forecast should therefore show a range and explain what changes it. The range does not need to imply a formal statistical confidence interval unless one has actually been calculated. It can simply be a scenario analysis demonstrating how sensitive the decision is to uncertain inputs.
| Illustrative parent volume | Assumed ratio | Modeled result |
|---|---|---|
| 10,000 | 0.01 | 100 |
| 10,000 | 0.02 | 200 |
| 10,000 | 0.04 | 400 |
The next step is to ask whether the same content investment remains sensible across the range. If it does, the exact estimate may be less important. If the decision changes completely, the team needs more evidence before committing a large budget.
Demand is not the same as reachable traffic
A topic can attract substantial interest without producing many visits to a particular website. Users may receive an answer without clicking, choose a different source or return through another channel. A demand estimate cannot by itself predict the site’s share of those outcomes.
The forecast needs separate assumptions for visibility, citation or inclusion, click behavior and the value of a resulting visit. Multiplying several uncertain percentages can create a very precise-looking number with a very weak foundation. Make the assumptions visible rather than compressing them into a single promised lead total.
For a directory, an important outcome may be a qualified comparison session or a relevant contact action. A broad definition query may generate interest but little buying intent. A smaller topic concerning a specific service need may be more valuable to the business even if its modeled demand is lower.
Prioritization should therefore include both scale and fit. A high-volume topic that the site cannot address distinctively may be a worse investment than a narrower topic where it has credible information and a clear reader need.
Build topic groups around decisions
Start with the questions a buyer must resolve. For an agency directory, those might include service scope, sector experience, geographic coverage, engagement model, evidence quality and how to compare proposals. Several prompts and keywords can map to each decision.
Then identify the resource that would serve the decision best. It might be a category page, a methodology explanation, a comparison article or a practical checklist. Creating a separate page for every prompt variation can fragment the information and make maintenance harder.
Use the estimate to help order the work within that structure. A topic with higher apparent demand may deserve earlier attention, but only if the page has a defined purpose and a realistic source of value. The structure should not be dictated entirely by the largest number in a tool.
Keep a record of which prompts each page is intended to support. That creates a useful test set for later observation without pretending the set represents every possible conversation. Update the set when customer needs or product language change, not merely to improve a reported visibility percentage.
Compare opportunities with a small decision table
A planning table can combine several dimensions without producing an opaque proprietary score. Record estimated demand, business relevance, current page quality, available evidence and implementation effort. Each field should have a short explanation rather than an unexplained number.
For example, a topic may have modest estimated demand but high relevance because it reflects a recurring sales question. Another may have broad interest but weak evidence available to the publisher. The table makes that tradeoff visible to the editorial and commercial teams.
Avoid treating the dimensions as perfectly interchangeable. A very high demand estimate should not compensate for an inability to provide accurate information. Some criteria are gates: if the central claim cannot be supported, the page should not be published simply because the opportunity appears large.
This approach also makes disagreements productive. Instead of debating whether a topic “feels important,” the team can identify whether it disagrees about demand, audience fit, evidence or effort. Those are questions that can be investigated separately.
Keep observed data separate from planning assumptions
Once content is published, the team will accumulate direct observations: visits, engagement, inquiries, reported citations or sampled answer appearances. Store those alongside the original assumptions, but do not overwrite one with the other. The difference is part of what the project is learning.
If observed referrals are lower than expected, several explanations remain possible. The demand estimate may be high, the page may not be visible, users may not click, or the topic may attract a different audience. A single disappointing total does not identify the cause.
Investigate the path in stages. Is the page accessible and useful? Does it appear in relevant observations? Are visits reaching the correct destination? Do those visits engage with the intended resource? This sequence is more informative than immediately rewriting the headline or increasing keyword repetition.
The same discipline applies to positive results. A successful page may validate the investment without validating every numerical assumption used to justify it. Report the observed result and the remaining uncertainty separately.
Watch for false precision in agency proposals
A forecast that promises an exact number of AI leads from a modeled demand estimate deserves scrutiny. Ask how each step was calculated and which inputs are directly observed. Ask whether the provider has used comparable data from the same market, audience and type of page.
The provider should also explain what would change the forecast. If a model definition changes or a platform alters how it sends referrals, the reporting process needs to adapt. A fixed promise built on changing inputs can quickly become misleading.
A stronger proposal describes a range of outcomes, a concrete content plan and a measurement process. It identifies what the team controls—research, implementation, accuracy and testing—and what depends on external systems or user behavior.
That does not make the proposal less ambitious. It makes the ambition accountable. A business can pursue a large opportunity while still distinguishing an investment thesis from a guaranteed result.
A useful metric can remain imperfect
It is tempting to reject an estimate because it is not a census. That would discard many useful planning tools. The better standard is whether the metric helps make a decision when its limitations are understood.
For comparing broad topic opportunities under a consistent method, a proxy may be informative. For billing based on exact prompt counts or promising a precise market share, the same proxy may be inadequate. Suitability depends on the decision, not just the existence of uncertainty.
Teams should periodically check whether the metric still improves prioritization. Compare planned opportunities with actual reader needs and observed outcomes. If the estimate repeatedly directs effort toward weak topics, revise the process instead of defending the number because it appears in a respected tool.
The best use of AI Adjusted Volume is therefore as a structured input to judgment. It can help organize a difficult measurement problem, while the publisher remains responsible for selecting worthwhile topics and creating resources that deserve attention.
The planning question has become more explicit
Ahrefs’ methodology explanation makes an important conversation possible: what exactly are we estimating, and how should that estimate influence the work? That is healthier than treating every demand number as an equally direct observation.
For SEO, AEO and GEO teams, the next step is to preserve definitions, model scenarios and connect topics to real decisions. A page should have a reason to exist beyond a large estimated number. When demand, relevance and distinctive evidence align, the investment case becomes stronger even without pretending that conversational search is fully measurable.
Preserve the original forecast for the later review
When a topic is approved, save the estimate, assumptions and reason for choosing it. Do not quietly replace the original figures with newer values before reviewing the result. The original record is what allows the team to learn whether its planning process was useful.
Separate a weak estimate from weak execution. A promising topic can underperform because the resource was incomplete or published late. A modest topic can outperform because the page solved a neglected problem. The review should inspect both the demand assumption and the quality of the finished work.
For a small editorial team, this can be a short note attached to the brief: expected audience, modeled range, business relevance and the evidence the article will contribute. A later review can then compare the actual outcome with a real decision, rather than reconstructing a more flattering explanation after the fact.
This discipline also makes budget conversations less adversarial. The team can discuss which assumptions changed and what it learned, instead of arguing over whether one number was right or wrong. A model earns its place by improving decisions over time, not by appearing certain at the moment of purchase.
Source and analysis note: The description of AI Adjusted Volume is attributed to Ahrefs. The numerical scenarios, prioritization framework and forecasting recommendations are original analysis. The example ratios are illustrative and do not represent platform measurements or promised traffic.