
The Search Brief · News analysis
The France AI Overviews Study Reports a 23.1% CTR Drop: What the Finding Can—and Cannot—Tell You
The France AI Overviews study reports lower CTR in a highly exposed group. Examine the denominator, study limits and implications for your own measurement.
Development covered: September 16, 2026
The arrival of AI Overviews in a new market creates an unusually useful research opportunity: analysts can examine a before-and-after period instead of trying to reconstruct a change that has been developing for years. A September study of French search results offers that kind of evidence, with a substantial click-through-rate decline among sites more exposed to AI Overviews.
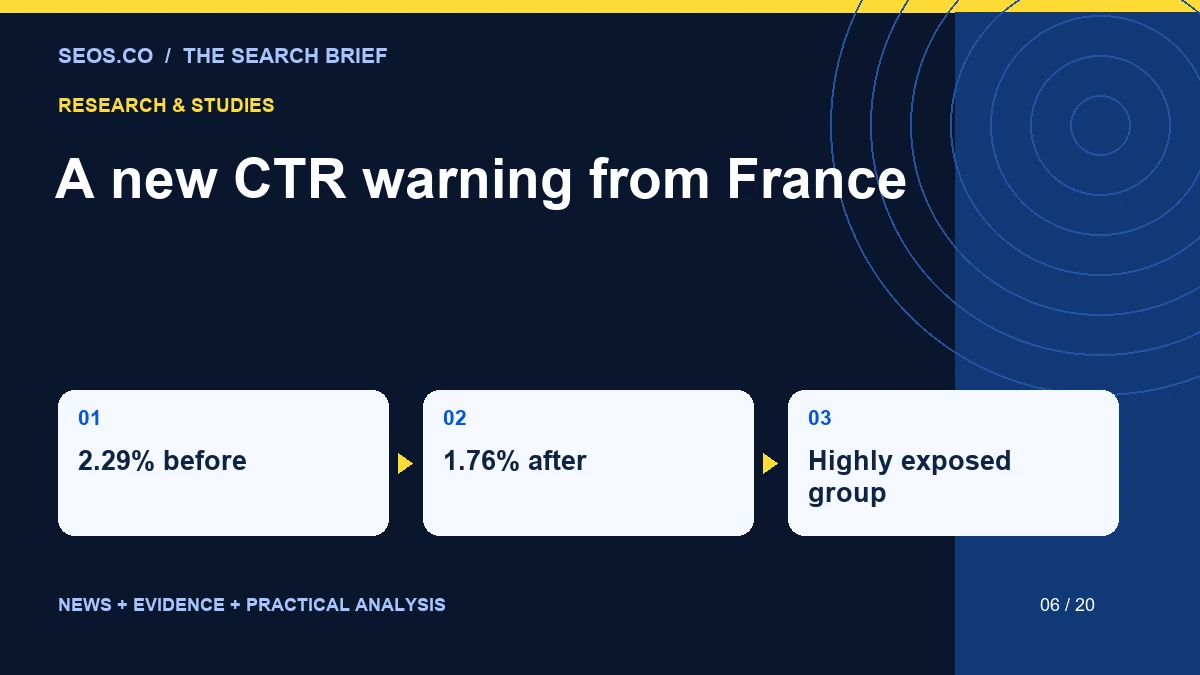
The Ahrefs study published September 16 examined 963 domains selected from a high-traffic French panel around the July 22 rollout. It compared 28 days before launch with nine days afterward. In the group with more than 20% AI Overview exposure, median CTR moved from 2.29% to 1.76%, a 23.1% relative decline. A low-exposure group, below 2%, recorded a 2.3% increase. Authors Juliette Bègue and Xibeijia Guan present observational evidence, not a randomized experiment covering every French website.
That is a meaningful warning for publishers. It is also a finding that can be distorted easily when a group-level result becomes a universal forecast. The useful response is to examine how a site’s own queries, pages and commercial outcomes are exposed, while preserving the limitations that make the study interpretable.
The percentage needs its denominator
A fall from 2.29% to 1.76% is a reduction of 0.53 percentage points. Dividing that difference by the starting value gives the relative decline of approximately 23.1%. Both descriptions are valid, but they answer different questions. Calling the change “23 percentage points” would be incorrect and would dramatically exaggerate the result.
An illustrative calculation makes the distinction tangible. At a fixed 100,000 impressions, a 2.29% CTR corresponds to 2,290 clicks, while 1.76% corresponds to 1,760 clicks. The difference is 530 clicks. This is an arithmetic example using the reported rates; it is not the study’s observed click total, and it assumes impressions remain constant.
Real sites do not usually enjoy that constant denominator. Search demand, rankings, query mix and the number of impressions can all change. A site might lose CTR while gaining clicks if impressions rise sufficiently. Another might hold CTR steady and lose clicks because demand falls. The rate is important, but it must sit alongside the underlying counts.
| Description | Correct interpretation |
|---|---|
| 2.29% to 1.76% | The reported median rates for the highly exposed group |
| 0.53 percentage points | The absolute difference between those rates |
| About 23.1% | The decline relative to the starting rate |
| 530 fewer clicks per 100,000 impressions | An illustrative fixed-impression calculation |
Why a comparison group helps—and does not settle causality
A before-and-after observation can capture many changes at once. Search behavior may shift with the season. Rankings may move. A major event may change what people search for. Comparing a more exposed group with a less exposed group helps examine whether the pattern is concentrated where the new feature is more common.
The comparison does not make the groups identical. Sites exposed to many AI Overviews may differ in topic, query intent, audience and business model from sites with little exposure. Those differences can influence CTR independently. A careful reader should therefore treat the comparison as stronger context for an association, rather than proof that every lost click was caused by the feature.
The short post-launch window is another reason for restraint. Early behavior can differ from a mature product experience. A nine-day period can reveal a sharp immediate pattern, but it cannot establish the long-term equilibrium for publishers, searchers or advertisers. Future observations may confirm, moderate or complicate the initial finding.
These limitations do not make the study useless. They define what the evidence can support. A business can take an observed risk seriously without pretending that the available data supplies an exact forecast for its own pages.
The unit of analysis changes the story
A domain-level median is not the same as a pooled CTR across every impression in a dataset. It also does not describe the experience of a typical individual query. These distinctions matter when a headline is carried into a board presentation or an agency sales deck.
Suppose one hypothetical domain has a million impressions and another has ten thousand. A median across domains does not give the larger site one hundred times the influence simply because it has more impressions. A pooled rate would behave differently. Neither approach is inherently wrong, but the interpretation must match the calculation.
For a site owner, the practical lesson is to preserve several views. Domain totals explain business scale. Page groups explain where the risk is concentrated. Query-level samples help investigate the underlying search experience. A single headline metric cannot perform all three jobs.
When commissioning analysis, ask what is being averaged, weighted or compared. That question is often more valuable than asking for another decimal place. Precision in a displayed number does not resolve ambiguity about the population it represents.
Segment by the job the searcher is trying to finish
The most useful exposure assessment begins with intent. A short factual question, a complex product comparison and a search for a particular company are different journeys. They may all generate impressions, but a visit has a different role in each one.
For a factual query, a search result may answer the immediate question. For a comparison, the visitor may still need detailed evidence, current pricing or a way to evaluate tradeoffs. For a branded query, the user may be trying to reach a known destination. Those distinctions help determine what a lost click means and what a useful page should offer beyond a summary.
A directory should pay particular attention to evaluation tasks. A list of agency names can be summarized easily. A transparent comparison process, clear scope, evidence dates and useful questions for a buyer can support a more involved decision. That does not guarantee a click, but it gives the destination a stronger reason to exist.
Do not respond by making every article longer. Length is not a substitute for a missing decision aid. The better question is whether the page contains something a reader needs to inspect, use or verify after receiving a broad answer elsewhere.
Build a local baseline before rewriting the site
Start with a defined period and a stable set of pages. Export impressions, clicks and CTR, and retain the query and device dimensions that are available. Record significant site changes, campaigns and seasonal events. This produces an accountable baseline rather than a memory of how traffic used to feel.
Next, classify a manageable sample of important queries. Document whether an AI Overview is observed, when the observation occurred and the market or device context. A manual observation is a sample, not proof of universal availability. Search experiences can differ, so the record should preserve the conditions instead of treating one screenshot as a permanent property of the query.
Then compare like with like where possible. A page group’s current performance against a comparable earlier period is useful, but include a broader context for demand. Avoid selecting only the worst-performing pages after the fact and presenting them as representative of the whole site.
The first deliverable should be a map of exposure and business importance. That allows a team to prioritize pages where a change in search behavior could affect meaningful outcomes, rather than spending equal effort on every low-volume informational query.
A practical response has three workstreams
The first workstream is measurement. Separate impression changes from CTR changes, and separate both from changes in the value of visits. A smaller number of more qualified visits can have a different business effect from a broad decline in valuable demand. Neither scenario should be assumed without evidence.
The second is content. Identify pages that merely repeat a short answer and ask what additional decision support they can reasonably provide. Original examples, transparent calculations, comparison criteria, current source references and clearly stated limitations can all help when they are relevant. Adding unrelated sections to inflate word count does not solve the underlying problem.
The third is distribution. A publisher dependent on one discovery surface should consider how readers can return directly, follow a topic or discover the same expertise through another appropriate channel. This is a business resilience question as much as an SEO question. It does not require abandoning organic search; it requires understanding its role in a broader audience relationship.
| Workstream | Useful first output | Weak substitute |
|---|---|---|
| Measurement | Exposure map tied to valuable pages | One sitewide percentage without context |
| Content | A specific missing decision aid | A longer introduction repeating the query |
| Distribution | A relevant route for repeat readership | Posting the same excerpt everywhere |
What not to infer about AI citations
A CTR study does not establish which writing style causes a citation. It does not prove that a particular schema type wins placement, that a file in the site root changes recommendations, or that adding a fixed number of questions will recover lost traffic. Those are separate claims requiring separate evidence.
The temptation to attach an optimization formula to a worrying statistic is understandable. Businesses want a response they can purchase and measure. The responsible response is to distinguish established technical requirements, plausible editorial improvements and experiments whose effect is not yet known.
For an experiment, define the intended mechanism. If a comparison table is added, explain what information it makes easier to evaluate. If a source is updated, explain which stale claim it corrects. If navigation changes, identify the discovery problem it addresses. These are more meaningful descriptions than saying the page now has a higher GEO score.
Keep a change log and an observation period. When several changes happen together, report that limitation. A measured improvement can be useful even when a team cannot isolate every cause, but it should not be sold as proof of a secret ranking technique.
Agency buyers should ask for evidence at the same level as the claim
A proposal claiming that all informational traffic will fall by the study’s headline percentage is overgeneralizing. A proposal that ignores the study because it is observational is also missing useful evidence. The more credible position is to identify where the client’s own situation resembles or differs from the research setting.
Ask the agency to show affected page groups, observed search experiences and the business purpose of the recommended changes. Ask how it will distinguish a demand decline from a CTR decline. Ask which outcomes it can measure directly and which remain uncertain. These questions expose whether the work is grounded in the site or merely borrowing a dramatic headline.
A sensible engagement can begin with a limited set of important pages. That creates room for careful diagnosis and a clear release record. It also reduces the risk of a sitewide rewrite based on an external average that may not describe the business.
The budget should reflect the uncertainty. Exploratory work needs a learning objective and a stopping rule. Foundational repairs, such as missing content or broken navigation, can be justified on their own merits. Mixing those categories makes both reporting and accountability harder.
The finding deserves attention without becoming a universal forecast
The France research is valuable because it captures a market transition and supplies a concrete signal worth investigating. The next useful step is not to repeat the number more forcefully. It is to connect the observed pattern to the pages, queries and decisions that matter for a particular publisher.
For an editorial team, that means preserving the difference between a reported result and an inference. For an SEO team, it means keeping impressions, CTR, clicks and outcomes visible together. For a business owner, it means asking whether the website offers enough useful evidence to remain a worthwhile destination when a search interface provides a preliminary answer.
The strongest response will be specific. A page that helps a buyer compare alternatives, verify a claim or complete a task has a clearer role than one that exists only to restate a definition. That is a practical content strategy, even while the longer-term traffic effects of AI Overviews continue to develop.
Distinguish the reporting decision from the investment decision
A business may decide to report AI Overview exposure immediately while waiting for more evidence before changing its content budget. Those are compatible choices. Measurement can begin with a modest sample, whereas a major editorial investment may need a stronger understanding of which pages and customer journeys are affected.
This separation prevents urgency from becoming overreaction. The study can justify closer observation today without requiring a prediction that every category will behave identically. A well-kept baseline also makes a later investment decision better informed, because the team has preserved its own evidence instead of relying only on an external headline.
Source and analysis note: Study design and the reported group-level figures come from the linked Ahrefs research. The fixed-impression example, audit framework and recommendations are original editorial analysis. They should not be read as a prediction of SEOS.co’s traffic or as a causal estimate for an individual website.