
The Search Brief · News analysis
Bing Adds Citation Share, Intents and Topics: How to Turn the New Views Into Editorial Decisions
Bing adds topics, intents, citation share and comparisons. Work through the denominator and turn the new reporting views into practical editorial decisions.
Development covered: June 16, 2026
Bing’s AI reporting is moving beyond a list of referenced URLs toward a more structured view of the questions behind those references. Its June expansion adds topic and intent groupings, a citation-share metric and period comparisons. For publishers, the opportunity is to connect observed visibility with editorial decisions—provided the denominator and the classification remain visible.
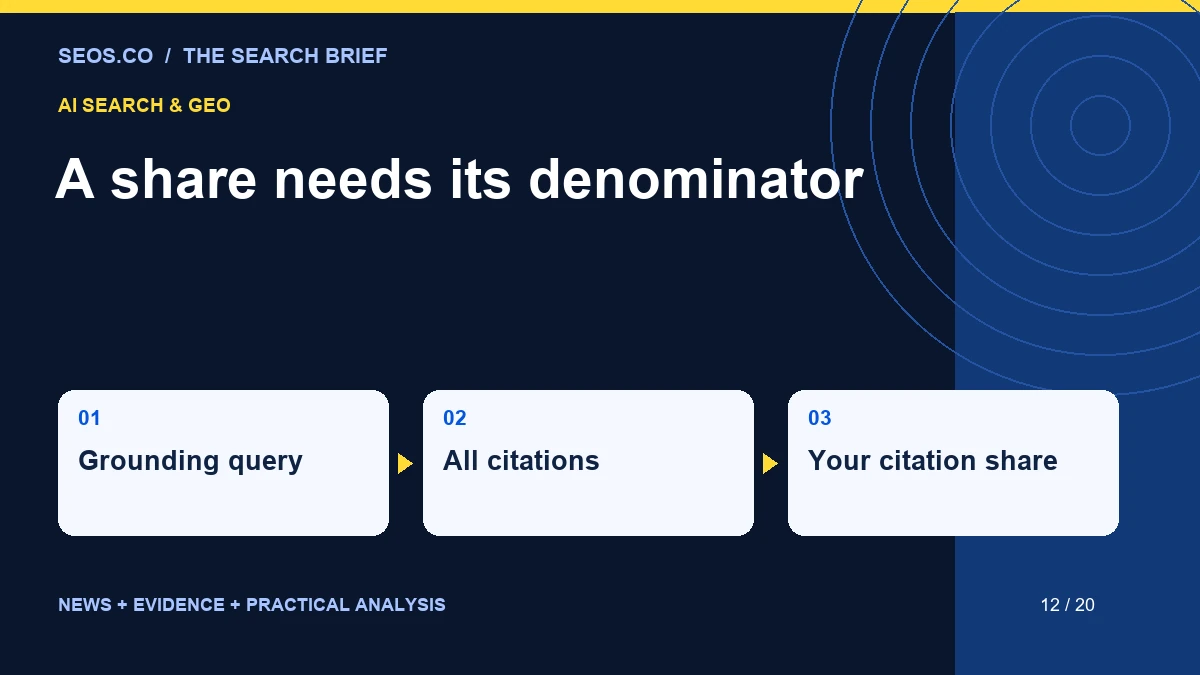
Microsoft’s June 16 announcement introduced Intents, Topics, Citation Share and Compare in public preview. Intents classify grounding queries; Topics group related meanings. Citation Share compares a site’s citations with citations across sites for the same grounding query. Microsoft distinguishes the measure from traffic share, ranking and quality scoring, and the report does not expose competitor domains. Compare supports period analysis within the reporting views. These are useful organizing tools, but none establishes why a change happened.
The most consequential addition may be the ability to ask a better question. Instead of asking only whether citation counts increased, a team can examine which needs are represented, where coverage is concentrated and whether a change in share reflects its own growth or a changing denominator.
Share and count can move in opposite directions
Consider an illustrative query with 20 citations to a site out of 100 citations across the measured set. The site’s share is 20%. In a later period, the site receives 30 out of 200. Its count has increased by half, while its share has fallen to 15%.
That is not a contradiction. The denominator grew faster than the numerator. A report showing only the share would miss the site’s absolute growth. A report showing only the count would miss the fact that the broader measured citation activity expanded more quickly.
The reverse can also occur. A site might receive fewer citations while gaining share if the overall pool contracts more sharply. Neither metric is inherently the correct one; they describe different aspects of the situation.
| Illustrative period | Site citations | All citations for the query | Share |
|---|---|---|---|
| Period A | 20 | 100 | 20% |
| Period B | 30 | 200 | 15% |
These figures are invented to explain the calculation. They are not Bing measurements for SEOS.co or any competitor. The point is to keep the numerator and denominator available whenever a share metric becomes part of a business discussion.
Topic groupings are useful editorial hypotheses
A topic cluster can reveal a coherent area of observed demand or retrieval activity. It can also combine phrases that look similar but serve different readers. Treat the grouping as a useful starting point for review, not as a finished content architecture.
Inspect representative queries and the pages associated with them. Ask whether the group reflects one decision or several. A topic concerning agency pricing might include basic budget planning, contract comparison and questions about particular deliverables. Those needs may require different explanations within a coherent resource.
Do not create a new page merely because a dashboard displays a new label. First check whether an existing page already addresses the need and whether the distinction is meaningful to readers. Excessive fragmentation can make a site harder to navigate and maintain.
The editorial decision should explain what the proposed resource adds. A new page is justified when it serves a distinct purpose with adequate evidence. Otherwise, improving the organization or depth of an existing page may be the more useful response.
Intent labels need a human interpretation of the task
An automated intent category can help sort a large dataset, but it cannot substitute for understanding the user’s task. Broad labels often hide important differences in urgency, knowledge and decision stage. A reader researching a concept and a buyer comparing proposals may use overlapping language.
Review a sample before making a large strategic change. Note where the classification seems clear, where it is ambiguous and where the page’s purpose differs from the apparent query need. The ambiguity is information; it may indicate that the content needs clearer boundaries.
For a directory, a useful distinction is between discovering possible providers and evaluating a shortlist. A broad category page may support discovery, while a methodology or comparison resource supports evaluation. The same topic can therefore require connected resources rather than a single page trying to do everything.
Avoid writing for the label itself. A page designed to satisfy an abstract “commercial intent” category can become generic. A page designed to help a specific buyer compare scope and evidence has a clearer editorial purpose.
Period comparison is not a controlled experiment
The ability to compare dates makes changes easier to see. It does not isolate their causes. Demand, reporting coverage, platform behavior, competing resources and the site’s own releases may all change between periods.
Keep a release log beside the comparison. Record consolidations, major content revisions, technical fixes and changes in the observed query set. If a page’s URL changes, preserve the relationship between the old and new destination so the report does not mistake a migration for a disappearance.
Use comparable periods where practical and inspect the underlying counts. A dramatic percentage increase from a tiny baseline can be real without being commercially significant. Conversely, a modest percentage movement in a large, important topic can deserve attention.
The right conclusion may be that a pattern needs more observation. That is not a failure of analysis. It is a decision to gather enough evidence before making a larger change, rather than turning every fluctuation into a story about an optimization technique.
Build a coverage map before a production schedule
A coverage map connects observed topics to existing resources and business priorities. For each topic, identify the relevant page, its purpose, the evidence it contains and any important gap. Add the available citation observations without allowing them to replace the editorial assessment.
The map can reveal several kinds of work. A strong page may need only maintenance. A relevant but weak page may need research or clearer organization. An overlapping group may need consolidation. A genuinely missing resource may justify a new article.
This is more useful than turning every low-share topic into an assignment. A low number does not reveal whether the issue is content, access, demand or the scope of the report. Diagnosis should precede production.
| Coverage finding | Possible action | Evidence needed first |
|---|---|---|
| Important topic, outdated resource | Update the page | Current facts and specific stale claims |
| Several overlapping pages | Consider consolidation | Distinct purposes, links and traffic context |
| No resource for a real decision | Create a focused page | Audience need and supporting material |
| Strong resource, little observed coverage | Investigate | Access, clarity and representative query context |
Do not infer unnamed competitors from a share change
A share metric can tempt marketers to tell a competitive story even when the report does not identify competing domains. A decline may be described as a particular rival taking visibility, despite no direct evidence connecting the change to that business.
Keep that claim separate from what the report shows. If competitive research is needed, conduct it through appropriately documented observations and identify the conditions of the sample. Do not invent a competitor attribution to make the report feel more actionable.
The same restraint applies to content recommendations. A competitor’s visible page may contain a table or a particular heading, but that does not prove the feature caused its appearance. Comparing resources can identify substantive gaps without claiming access to the system’s selection logic.
A useful competitive review asks what evidence, explanation or functionality the other resource provides that the current page lacks. That produces an inspectable content brief. It avoids reducing the exercise to copying surface features whose causal role is unknown.
Connect topics to the website’s internal pathways
A reader rarely experiences a topic as an isolated URL. Someone learning about AI visibility may next need a measurement explanation, a technical access check or a way to evaluate a provider. Relevant internal links can support that sequence.
Use the coverage map to identify those relationships. Link where the destination advances the reader’s task, and use descriptive text that explains what the next resource offers. A collection of unrelated links added only to increase a count is less useful.
The architecture should also make categories understandable. A blog can distinguish platform news, research analysis and technical implementation while still connecting articles that address the same decision. Clear categories help readers browse and help editors maintain a coherent publication.
When adding a link, verify the destination and its current purpose. A technically valid URL can still be the wrong next step if the page has been repurposed or consolidated. Internal linking is an editorial relationship as well as a technical one.
Evaluate changes at the right scale
Some improvements affect a single passage, while others affect a template or an entire topic group. The evaluation should match the scope. A rewritten definition should not be credited with every sitewide change in citations. A repaired access rule may reasonably affect many pages, but the reporting still needs to identify the relevant population.
Define the expected mechanism before release. If a topic page is reorganized, the immediate checks concern clarity, completeness and navigation. Later visibility observations can test whether the page’s representation changes, but they do not replace those basic quality checks.
Preserve negative and inconclusive results. If a change does not produce the hoped-for pattern, investigate rather than selectively reporting only the successful examples. A learning process needs the full set of observations to improve future decisions.
This approach helps an organization distinguish useful editorial work from a sequence of unexplained dashboard movements. It also gives a client a clearer understanding of what an agency actually changed and why.
A practical reporting note can prevent major confusion
Every chart using Citation Share should name the metric, the period and the relevant query or grouping. Include enough context to show whether the numerator, denominator or both changed. A brief note can prevent a reader from interpreting the percentage as market share or traffic share.
For topic and intent views, state that the groupings are classifications used for analysis. If the team has manually reviewed or adjusted an internal mapping, document that separately rather than implying the platform supplied the final editorial judgment.
Reports should also distinguish direct observations from recommendations. “Coverage increased in this group” is an observation. “We should update the comparison page” is a proposed action based on several considerations. Keeping them separate makes the reasoning easier to assess.
The most useful presentation ends with a small number of decisions and the evidence behind them. A larger collection of charts is not necessarily a better analysis if the audience cannot tell what should happen next.
Better organization creates better questions
The June additions make Bing’s AI reporting more useful for editorial planning because they provide ways to organize observations. Their value depends on careful interpretation. A share is a ratio, a topic is a grouping and a date comparison is a change between periods. None is a direct instruction from the platform about what to publish.
For a website owner, the opportunity is to build a clearer relationship between observed visibility and the resources the audience needs. Map the topics, inspect the gaps, improve the pages and keep the measurement definitions intact. That is a practical route from a new report to better publishing decisions.
Choose a stable comparison set
When evaluating a topic over time, note whether the set of included queries or pages has changed. A broader set can increase observed activity even if the original resources behave similarly. A narrower set can make a decline appear larger than it is for the unchanged population.
Where practical, retain a stable comparison alongside the current broader view. The stable set helps assess continuity, while the broader view shows how coverage is expanding or contracting. Both can be useful, provided their purposes are clear.
This is particularly relevant after a content consolidation. The new resource may cover several old topics, and the reporting structure may no longer map neatly to the previous URLs. Keep an explicit mapping rather than assuming the dashboard will explain the editorial change automatically.
For a client report, a short note can be enough: which resources remained comparable, which were added and which were merged. That context makes the numerical movement easier to assess and reduces the temptation to tell a confident story from a ratio whose underlying population changed.
Source and analysis note: Feature descriptions are attributed to Microsoft’s June announcement. The share calculation, coverage map and planning recommendations are original editorial analysis. The example figures are hypothetical and do not describe a live account.