
The Search Brief · News analysis
Google Documents Regional Search Differences: Stop Treating One SERP as Universal
Measure regional Search with compatible market, query and device contexts. Keep feature availability, observations, blended rates and missing data distinct.
Development covered: September 8, 2026 overview introduction; checked November 2, 2026

Google's regional Search documentation makes one measurement rule unavoidable: compare search experiences within the market, query class, device, and observation context where they actually occur. A result page seen from one office is not a universal interface, and a blended site metric can move even when performance within each market stays unchanged.
Google added its regional feature overview in September 2026. The current guide maps different feature families to regions and query categories. The practical implication is a segmented observation and reporting design, not a claim that every business can activate every feature.
This article develops that design with hypothetical calculations and a proposed observation protocol. It does not report a live multi-country study or infer a ranking change from a documentation update.
Separate feature availability from observed appearance
Availability describes the documented scope in which a feature can appear. An observation records whether it appeared for one particular search under stated conditions.
A feature can be available in a market without appearing for every relevant query. Conversely, a screenshot without trustworthy location context cannot establish the market's documented availability.
Keep those fields separate in the evidence record. “Eligible context, not observed” is different from “outside documented scope,” “test could not run,” and “feature observed.”
This distinction prevents a monitoring system from turning every absent unit into a failure. It also prevents a favorable screenshot from becoming a claim of universal coverage.
Define the market before choosing queries
Record the audience geography, language, business service scope, and relevant content. A language alone is not a market, and a domain suffix alone does not establish the intended searcher's location.
Choose queries that represent real reader or buyer tasks in that market. A direct translation can change meaning, local terminology, or commercial intent.
Use actual first-party query evidence where available, supplemented by local research and qualified language review. Do not manufacture a large multilingual query list solely by substituting city names.
Document what is inferred and what is observed. A proposed query can belong in the research plan without being described as proven demand.
Map query classes to feature families
Group queries by the task and feature context, such as local business selection, travel comparison, product discovery, jobs, or information requiring interactive data.
Then consult the current specific documentation for the relevant feature. The overview is an index of opportunities; it is not the complete implementation contract for every unit.
Do not assume that similar layouts share eligibility or measurement. An aggregator unit, a direct-supplier unit, a carousel, and an ordinary text result can represent different journeys.
Keep the feature taxonomy versioned. If a provider changes names or supported scopes, historical observations should retain what was actually classified at the time.
Record a reproducible observation context
A useful observation includes query, intended market, observed location method, language, device, date and time, search-enabled surface, account or session context when relevant, visible feature, and destination URLs.
Preserve a screenshot or structured capture where permitted. It should support the classification, not substitute for the context record.
Google's Search Console performance guide notes that results vary with time, place, device, and recent history. A personal manual search therefore cannot be assumed to reproduce every user's experience.
Use fresh or controlled sessions when appropriate, but do not claim personalization has been eliminated. State the method's limits and repeat observations rather than relying on one especially convenient result.
Design the sample around the decision
A business deciding whether to investigate one local feature needs a different sample from a publisher studying cross-market result formats.
Define the decision first, then choose representative query classes, markets, devices, and repeat times. Avoid expanding the sample merely to produce an impressive observation count.
For a hypothetical plan with six markets, twenty-five queries per market, two device classes, and three observation rounds, the total is 900 planned observations. That arithmetic does not mean 900 independent users or 900 commercial opportunities.
Keep planned, completed, failed, and ineligible observations separate. A test that could not run is a gap, not evidence that the feature was absent.
Use a structured observation ledger
| Field | Purpose | Example of a misleading shortcut |
|---|---|---|
| Query and task | Identify what the person is trying to do | Treating translated strings as identical intent |
| Market and language | Define the intended context | Assuming language proves country |
| Device and session | Preserve conditions affecting the result | Comparing a logged-in desktop view with an unknown mobile view |
| Feature classification | State what was actually seen | Calling every horizontal unit the same feature |
| Destination and role | Identify the resulting journey | Mixing aggregator and direct-provider clicks |
| Observation status | Preserve evidence quality | Converting failed collection into “not present” |
The ledger is a proposed research tool, not a provider reporting schema. Its value is making differences inspectable before analysts aggregate them.
Segment performance with compatible definitions
Search Console supports dimensions such as country, device, page, query, and search appearance. Its API documentation also describes grouping, filters, and limits on returned rows.
Use the available dimensions to compare relevant segments, while checking aggregation and completeness. Do not assume every interface feature has its own dedicated report dimension.
Keep the reporting surface explicit. Web search, Discover, image, video, news, and generative experiences can have different definitions and reports. A combined number should not silently change meaning between periods.
Retain extraction parameters and data freshness. An export filtered to top queries is not the same universe as a property total. Missing rows and privacy or system limitations need to remain visible.
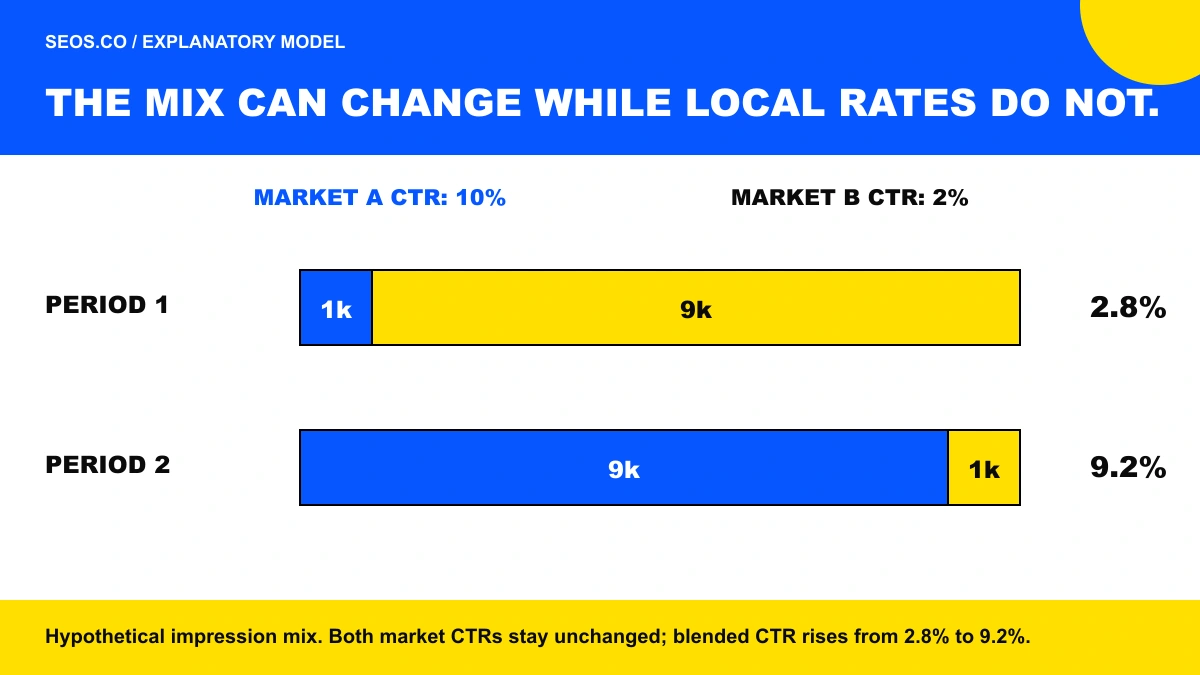
Why blended CTR can mislead
Consider two fictional markets with unchanged within-market click-through rates: Market A at 10 percent and Market B at 2 percent.
In the first period, A has 1,000 impressions and 100 clicks; B has 9,000 impressions and 180 clicks. The total is 280 clicks from 10,000 impressions, or 2.8 percent.
In the second period, A has 9,000 impressions and 900 clicks; B has 1,000 impressions and 20 clicks. The total is 920 clicks from the same 10,000 impressions, or 9.2 percent.
The blended rate rose dramatically even though neither market's rate changed. The mix changed. These are invented arithmetic inputs, not a search benchmark or a reported experiment.
Preserve the denominator
Report clicks and impressions alongside CTR. A percentage without its denominator can conceal a tiny sample or a large change in exposure.
Do not average segment percentages without appropriate weighting. The combined CTR is total clicks divided by total impressions, not the simple mean of every country's displayed percentage.
Keep eligible observations as a separate denominator for feature-presence studies. A feature present in twelve of twenty completed eligible observations has a different meaning from twelve appearances across one hundred mixed eligible and ineligible queries.
Record uncertainty when denominators are incomplete. A top-row API extract can be useful for diagnosis without representing the full query universe. Do not convert its share into universal market share.
Compare positions cautiously across layouts
A numerical position does not fully describe the visual page. Different result formats can occupy different space and support different interactions.
Inspect the actual relevant layouts when a position or CTR trend changes. A shift can involve query mix, device mix, feature composition, demand, or the page's own performance.
Do not assume the same ranking number creates the same opportunity in every market. The visitor's attention and available actions can differ even when a report displays a similar average.
Use screenshots and destination records to explain the mechanism under investigation. They add context, but they do not independently establish causal impact on traffic.
Keep destination roles separate
A regional feature may send a visitor to an aggregator's comparison page or directly to a supplier. Those journeys should not be merged indiscriminately.
Record the selected entity, destination URL, site role, and intended next action. A comparison-page visit is not yet a direct-provider booking.
Measure what the site can actually observe. An outbound referral from a directory and a completed service action on another business's site require different evidence.
Maintain stable entity and content identifiers across markets. Otherwise, regional URL differences can make the same underlying resource appear unrelated in reporting.
A worked diagnosis: sitewide improvement hid one market's decline
Imagine a fictional retailer whose total organic clicks rise after expansion into a high-volume market. The team initially reports that the new regional feature strategy succeeded everywhere.
Segmented analysis shows that the established market's qualified product visits declined, while the expansion market contributed enough new traffic to lift the total. A sitewide average concealed the local regression.
The next investigation examines the affected market's queries, destinations, availability, and result layouts. It does not change every regional page based on the blended trend.
This scenario is hypothetical. It illustrates why a positive total and a local problem can coexist, not a claim that expansion or a particular feature caused a decline.
Separate observation from causal explanation
A feature appearing at the same time as a traffic change establishes timing, not causality. Other changes may include campaigns, inventory, pricing, content updates, seasonality, or competitor behavior.
Log those interventions with dates and affected scope. A useful analysis explains which alternatives were examined and which remain unresolved.
A bounded test may help when the intervention is controllable and suitable comparison groups exist. Some regional differences cannot be randomized by the publisher, so a purely observational design should be labeled accordingly.
Do not invent a control group from unrelated markets simply because their totals look similar. Audience, query intent, demand cycles, and feature availability can differ materially.
Verify the local landing-page experience
A relevant result is useful only if its destination serves the visitor. Check language, currency, availability, service area, delivery constraints, and the actual next action.
Use the multilingual AI search evaluation to test whether the language-market version supports the local buying decision, including the offer and its qualifications.
Do not rely solely on markup or locale prefixes. A regional URL can still show a default-market offer after hydration or redirect according to a stale cookie.
Test clean direct entry from the public route. A local employee's warm browser can hide routing and authorization problems.
Use the site's international SEO guide to connect market targeting with actual content and delivery, rather than treating result-format observation as an isolated exercise.
Keep the reporting pipeline fresh and recoverable
Measure source availability, collection time, processing, caching, and dashboard publication. A dashboard can appear current while one market's collection stopped days ago.
Monitor freshness by segment. A successful global job should not mask a failed country-specific request or a query class that silently returned no rows.
Keep failed observations and retry history. Repeated attempts to collect one query are not additional independent observations. Preserve the logical observation identifier.
After a restart, reconcile pending collection work and completed records. An interrupted round should remain visibly incomplete until repaired, not disappear from the denominator.
Turn findings into a bounded action plan
Classify the finding before prescribing a change. It may be an eligibility gap, an entity-data issue, a landing-page defect, a measurement failure, a query-mix change, or an unproven opportunity.
Assign a concrete owner and acceptance evidence. “Improve European visibility” is too broad; “repair the direct destination for these verified supplier entities” can be tested.
Use site architecture best practices when a finding concerns routing or discovery, and internal-linking guidance when useful regional destinations lack coherent paths.
Keep future search observations separate from completed implementation. A repaired route can be verified now, while a later feature appearance remains unobserved.
What a credible regional report contains
State the markets, languages, query classes, devices, collection method, observation dates, and sample coverage. Include completed and failed counts.
Show segment-level totals before blended summaries. Explain meaningful mix changes and preserve the actual numerator and denominator behind percentages.
Link consequential provider claims to current documentation. Label the team's own interpretation and hypothetical examples separately.
End with the concrete decision supported by the evidence and the uncertainty that remains. A report should help a team act accurately, not make one screenshot sound like a universal law.
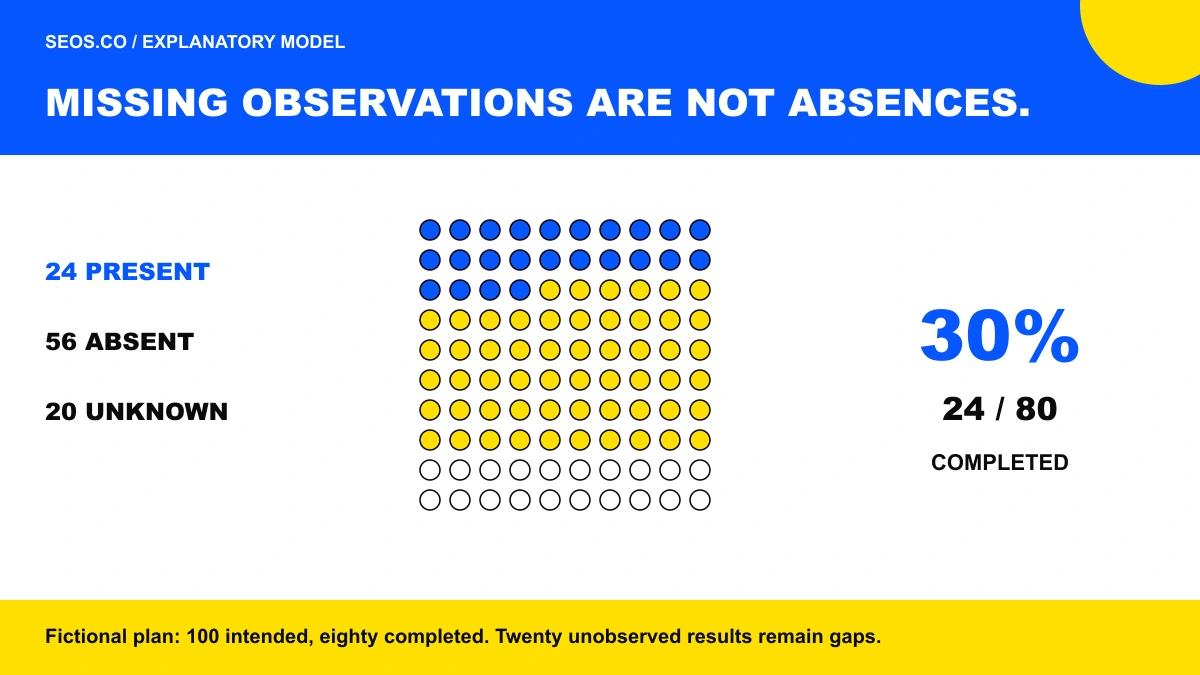
Preserve missing observations as missing
A regional collection job can fail because a request was blocked, the observer was unavailable, or the result could not be classified. Those conditions should remain separate from a confirmed absence.
Suppose a hypothetical round plans 100 eligible observations, completes 80, and sees the feature in 24. The observed presence rate among completed observations is 30 percent. Reporting 24 percent across all planned observations would treat the twenty missing observations as confirmed absences.
Neither number establishes the full market's feature rate. Report the completed denominator, the missing count, and the reason for the gaps. If the failures concentrate in one device or time window, the completed sample may be systematically different.
A retry should retain the original logical observation identifier and record its later collection time. It does not recreate the exact earlier search context. That distinction matters for time-sensitive queries and changing result layouts.
These records make the report less superficially tidy but more useful. They prevent collector inactivity from becoming a confident claim about what searchers did or did not see.
Practical answers
Can one search from my office validate a regional rollout?
No. It records one observation under that office's conditions. Define the relevant market and repeat a structured sample with clear collection context.
Can a rising global CTR prove every market improved?
No. A changing mix can move the total while individual segment rates stay unchanged or decline. Compare compatible segments and show the underlying counts.
What is the useful first step?
Build a small market-query-device ledger and connect it to segmented performance and destination checks. Google's regional documentation is most valuable when it leads to better measurement boundaries, rather than another universal claim about a search page that different audiences do not actually share.