
The Search Brief · News analysis
INP Optimization: Diagnose Slow Interactions Without Hiding Work
An interaction-level diagnosis workflow with a latency worksheet, proportional component chart and explicit bounds on hypothetical interventions.
Development covered: Primary-source guidance checked November 2, 2026
INP optimization begins by identifying which real interactions are slow and where their latency occurs: before the handler starts, while it runs, or before the browser presents the next frame. A smaller JavaScript bundle can help some pages, but it does not by itself explain a slow filter, navigation menu, or form response.
This guide proposes a diagnosis workflow that connects field observations to reproducible browser traces and complete user tasks. The numeric examples are hypothetical arithmetic, not measured case studies. The objective is a responsive, truthful interface rather than a metric improvement created by concealing unfinished work.
Know what INP measures
The Core Web Vitals guide places INP alongside loading and layout stability.
Interaction to Next Paint assesses responsiveness across qualifying interactions during a page visit. It concerns the time until the next visual update after an interaction, rather than the completion of every asynchronous consequence. Google's INP explanation describes that scope.
The recommended good threshold is 200 milliseconds or less at the 75th percentile, evaluated with appropriate mobile and desktop segmentation. Google's optimization guidance explains field diagnosis and the distinction between input delay, processing, and presentation delay.
Those definitions prevent a common mistake: treating an initial-load score as proof that later interactions are responsive. A page can load quickly and still freeze when a visitor opens a complex menu or changes a product filter.
They also prevent another mistake: treating a quick spinner as proof that the whole task is fast. Prompt feedback is useful, but the actual filter, purchase, or submission still needs to complete accurately.
Identify the interaction, not only the page
Collect enough context to distinguish a slow menu opening from a slow cart update on the same URL. Useful context can include template, route class, interaction type, target category, application version, device class, and whether the action occurred during startup or later.
Use privacy-conscious identifiers. Do not record typed field contents or sensitive personal data merely to diagnose latency. A semantic action name such as “open navigation” can be more useful than an unstable selector and less intrusive than capturing the whole interface state.
Keep sample counts and coverage visible. A percentile from a small or changing sample can move dramatically without a meaningful application change. Segmenting too finely can create unstable groups that look precise.
A field summary locates the problem population. It does not yet establish the mechanism. Use it to select representative conditions for tracing rather than immediately rewriting the component with the highest average.
Divide latency into its parts
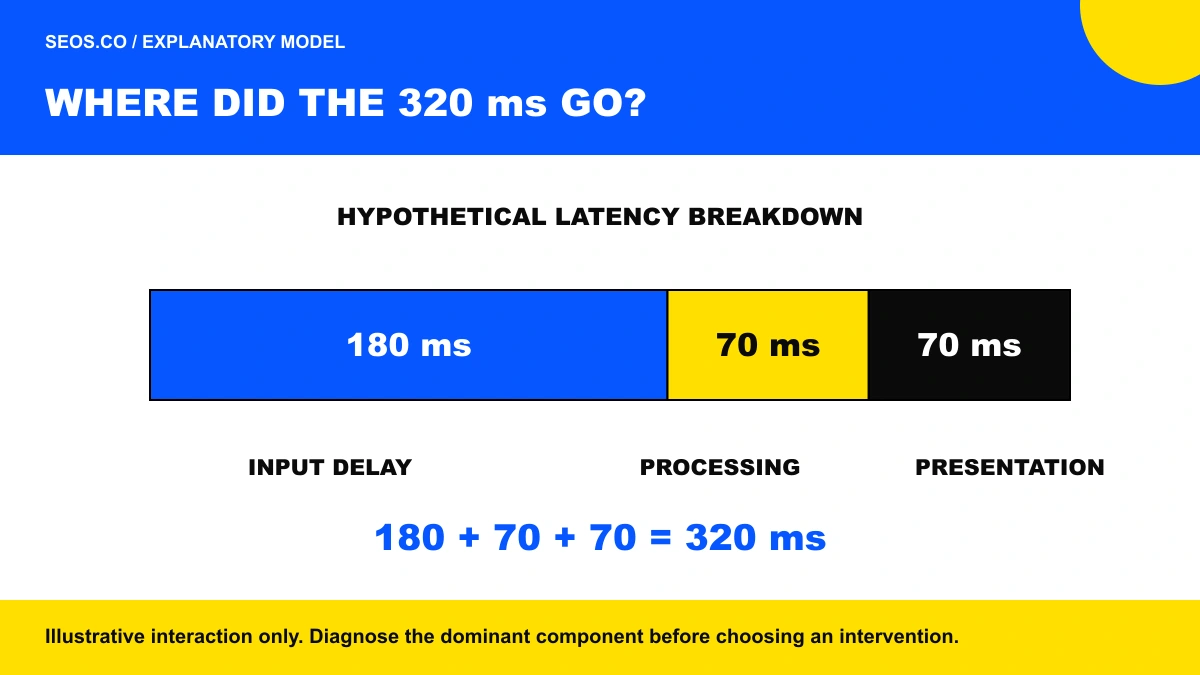
Input delay is waiting before event handling can begin. Processing time is the work performed by the relevant handlers. Presentation delay is the interval after handling before the visual update appears.
A hypothetical 320-millisecond interaction might contain 180 milliseconds of input delay, 70 milliseconds of processing, and 70 milliseconds of presentation delay. Optimizing a 10-millisecond helper in the handler cannot remove the dominant 180-millisecond wait.
The breakdown suggests different investigations. Input delay can point to other work already occupying the main thread. Processing can point to expensive application logic. Presentation delay can point to rendering work, layout, or other tasks before paint.
Do not infer the breakdown from a stopwatch alone. Use browser performance traces and available interaction attribution. Retain the trace, application version, and reproduction steps so another engineer can verify the interpretation.
Reproduce the field conditions
Use the page-speed guide to distinguish laboratory diagnostics from real-user measurements.
Test the relevant device class, page state, data volume, and timing. A filter operating on twelve sample products may behave very differently from one updating several thousand rendered rows.
Use a clean visit and a warm visit when the field evidence suggests both matter. Interactions during startup can compete with hydration, analytics, advertisements, and application initialization. Later interactions can compete with background synchronization or accumulated state.
Record the network and CPU conditions used for diagnosis. Artificial throttling can expose sensitivity, but it does not represent every real device. Compare like conditions before and after a repair.
Avoid one favorable run. Reproduce the original slow path several times and preserve variability. A change that improves the median but leaves severe tail behavior may still fail important visitors.
Investigate main-thread contention
Look for long work that precedes the interaction. The target handler may be inexpensive but unable to begin while another task runs.
Common candidates include large data parsing, expensive startup code, synchronous storage, third-party scripts, bulk DOM updates, and repeated calculations. These are hypotheses to trace, not a universal list of guilty components.
Check whether background work can yield or move away from the critical interaction path. Splitting work into smaller tasks can create opportunities for input and rendering, but the division must preserve correctness and avoid excessive overhead.
Google's long-task optimization guidance explains why work scheduling matters. Apply the relevant technique to the measured trace, then confirm that the complete task still produces the correct result.
Reduce handler work without breaking semantics
Inspect repeated calculations, unnecessary state updates, broad subscriptions, and data transformations inside the interaction. Determine which work is needed before the next visual response and which can occur later.
For a fictional product filter, the interface may need to acknowledge the selected option immediately, then compute or fetch the matching list. It should not claim the result is ready before the underlying operation completes.
Avoid redundant work. If several event listeners independently recalculate the same collection, consolidating ownership can improve both latency and consistency. A framework-level optimization may help, but first establish the actual duplicate operation.
Preserve cancellation and ordering. Rapid input can produce overlapping requests or computations. A later result should not be overwritten by an earlier slow result. Responsiveness includes showing the correct final state, not merely processing events faster.
Diagnose presentation delay
A quick handler can still trigger expensive rendering. Inspect style recalculation, layout, paint, and the size of the affected document region.
Large DOM updates can amplify a small state change. A filter may recreate every row, recalculate dimensions, and trigger layout across the page. Reducing the changed region or avoiding unnecessary measurements can be more relevant than optimizing the event callback itself.
Check for read-write patterns that force layout repeatedly. Measure before mutating where appropriate, group updates sensibly, and verify the trace after the change. Do not assume a code style change improved performance without observing the result.
Google's DOM-size guidance discusses the relationship between document complexity and responsiveness. Treat size as a diagnostic input, not a reason to remove essential content or discovery links indiscriminately.
Give immediate and honest feedback
A visible selected state, pending indicator, or disabled duplicate-submission control can reassure visitors that an action was received. The feedback should correspond to a real state transition.
Separate pending, successful, and failed outcomes. A form should not display success merely because a request was scheduled. A cart should not show a confirmed addition if the server rejected it.
Keep accessibility in the feedback contract. Keyboard focus, status announcements where appropriate, and understandable error messages help users follow asynchronous work.
Measure task completion alongside INP. A quick initial paint followed by a ten-second silent wait can still be a poor experience. Record response feedback and eventual outcome as distinct measurements rather than forcing one metric to describe the whole journey.
Use workers for appropriate computation
A web worker can move suitable computation off the main thread, but it cannot directly perform ordinary DOM updates. Serialization, transfer, startup, and coordination also have costs.
Consider workers for substantial independent calculations or data processing where the measured workload justifies them. Avoid adding a worker architecture to a trivial handler solely because the technique is fashionable.
Define cancellation, versioning, and result ownership. If a visitor changes filters repeatedly, the worker's output must correspond to the latest requested state. A fast stale result is still wrong.
Google's web worker guidance explains the capability and tradeoffs. Test the complete transfer-and-render path, not only the isolated computation speed.
A worked scenario: the slow filter with a fast handler
Imagine a fictional catalog whose filter callback takes 35 milliseconds. A developer focuses on that function because visitors report freezing when selecting a certification.
The trace shows a different dominant mechanism. A scheduled analytics batch occupies the main thread immediately before input, adding 170 milliseconds of waiting. The filter then replaces a large list, adding another 110 milliseconds before paint.
The hypothetical total is 315 milliseconds: 170 plus 35 plus 110. Removing five milliseconds from the callback would barely change the result. The useful repairs target scheduling of the analytics work and the scope of the rendered update.
Verification repeats the same interaction during the analytics window with the same inventory size. It checks the latency breakdown, correct product results, keyboard state, and final task completion. The example is illustrative and does not imply that analytics is the cause of another site's slow interaction.
Watch third-party impact without guessing
Attribute trace time to actual script activity where possible. A third-party label does not prove that a script caused the observed interaction delay, and a first-party bundle can contain equally expensive work.
Compare configurations in a controlled way. Temporarily disabling a component in diagnosis can establish a useful difference, but several components may share dependencies or change layout when removed.
Record the business function before deciding to remove a script. Consent, fraud prevention, payment, and measurement features have different roles. The repair can involve scheduling, scope, or integration changes rather than deletion.
Verify the resulting user journey and data collection. A faster interaction accompanied by broken checkout or missing essential consent behavior is not an accepted optimization.
Preserve content and discovery during performance work
Virtualization and deferred rendering can reduce work, but they can also change which content and links are present. Review the implications for the page's actual purpose.
A large interactive table may benefit from rendering only the visible rows for users while providing another appropriate accessible representation. A product collection still needs a coherent discovery path to intended items.
Do not hide substantive article content or critical product facts to produce a cleaner trace. The performance contract should include content availability, extraction, and accessibility alongside latency.
Where incremental loading is used, follow a deliberate segment and URL policy. Google's pagination guidance addresses discovery for those patterns. Performance and retrieval need coordinated design.
Test repeated and interrupted interactions
A first interaction can be fast while repeated actions accumulate listeners, retained nodes, or queued work. Exercise the action enough times to reveal growth in latency or memory.
Test rapid changes, cancellation, navigation away, and back navigation. An abandoned operation should not update the wrong page or retain unnecessary work indefinitely.
Check failures. A network timeout or worker error should produce truthful feedback and allow recovery. An interface that remains permanently pending is a task failure even if its initial response was quick.
Include background conditions implicated by the field evidence. If slow interactions occur during autosave or synchronization, a test that disables those systems misses the original trigger.
Validate deployment and field outcomes
The Core Web Vitals checklist provides companion release checks for the broader experience.
Confirm that the deployed version contains the repair and that the observed interaction path uses it. Cache and rollout differences can leave some visitors on old code.
Repeat the laboratory trace under equivalent conditions. Report which latency component changed and whether the task remained correct. Do not attribute the whole difference to one change when several interventions launched together.
Then observe representative field data with adequate sample and time. Field distributions reflect real devices and behavior, so they may differ from a laboratory result. State sample coverage, segmentation, and missing attribution.
A passing local trace is evidence of a reproducible implementation improvement. A sustained field change is another layer. Ranking, conversion, and revenue effects require their own evidence and should not be inferred from the metric alone.
Calculate a realistic optimization target
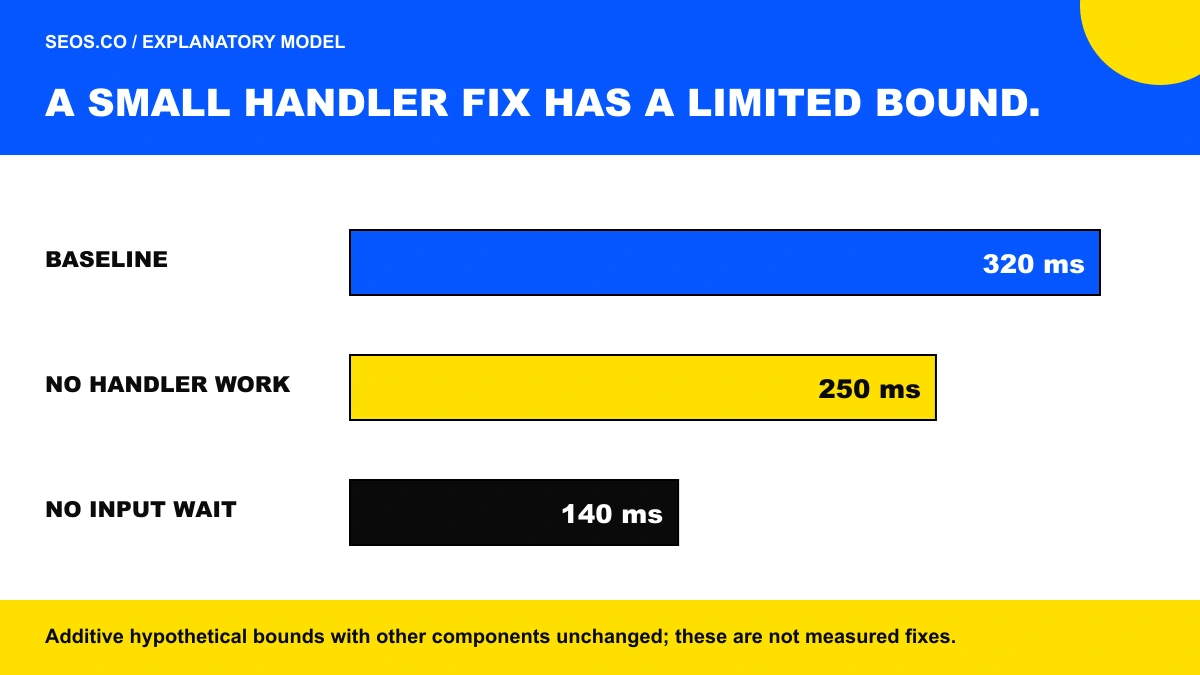
Use the measured breakdown to estimate the maximum plausible effect of a proposed intervention. If input delay is 180 milliseconds out of a 320-millisecond interaction, removing all 70 milliseconds of handler work would still leave 250 milliseconds under the same conditions.
That arithmetic does not mean the components are perfectly independent. Changing work can alter scheduling and rendering. It does show why a proposal should target the dominant mechanism rather than promise an arbitrary percentage improvement.
Set a concrete acceptance condition: the former slow interaction is reproduced, its dominant delay is reduced under equivalent conditions, and the complete task remains correct. Add field objectives according to actual sample quality and audience.
Keep guardrails for error rate, task completion, accessibility, content availability, and resource use. A worker or scheduling change can shift cost elsewhere. The goal is a better visitor experience across the whole operation.
A latency worksheet for the hypothetical interaction
The 320-millisecond example separates the parts that a proposed repair can affect.
| Component | Hypothetical duration | Diagnostic implication |
|---|---|---|
| Input delay | 180 milliseconds | Work already occupying the main thread dominates |
| Handler processing | 70 milliseconds | Optimizing the handler addresses only this portion directly |
| Presentation delay | 70 milliseconds | Rendering and scheduling before paint still matter |
| Total | 320 milliseconds | Sum under the stated illustrative model |
| Total if all handler work disappeared | 250 milliseconds | A bound under unchanged-other-component assumptions |
This is arithmetic, not a measured optimization result. Real scheduling interactions can change the components together, so a proposal must be verified with equivalent traces and the complete user task.
Practical answers
Does a fast page load mean INP is good?
No. Interactions later in the visit can be slow even when initial loading is fast. Investigate the actual action and timing reported in field evidence.
Can showing a spinner solve the problem?
Prompt feedback can improve the experience, but it does not establish that the underlying task is fast or successful. Track pending, completed, and failed outcomes honestly.
What proves INP optimization worked?
The original slow interaction has a reproducible trace, the deployed repair reduces the relevant delay without breaking the task, and representative field observations support sustained improvement. Keep those claims separate from later search or commercial outcomes. INP optimization is strongest when it improves real responsiveness rather than merely changing what a metric can observe.