
The Search Brief · News analysis
Pew’s AI Overview Click Study: Read the Denominator Before Forecasting Traffic
Read Pew’s historical AI Overview click findings with the right population, timing and denominator, then build transparent site-specific scenarios.
Development covered: July 22, 2025 publication; primary source checked November 2, 2026
Pew Research Center’s 2025 analysis found that observed Google visits associated with AI summaries were less likely to lead to traditional search-result clicks than visits without summaries. That is important descriptive evidence about user behavior in the studied setting. It is not a randomized estimate of the traffic any individual publisher would have received if AI summaries had been absent.
A useful reading preserves the population, observation period, exposure measurement, and click definition. A useful forecast then combines those limits with the publisher’s own query mix, landing pages, conversion behavior, and uncertainty. Treating one aggregate percentage as a universal traffic haircut skips the part of the analysis that determines whether the estimate is relevant to the business.
What Pew observed
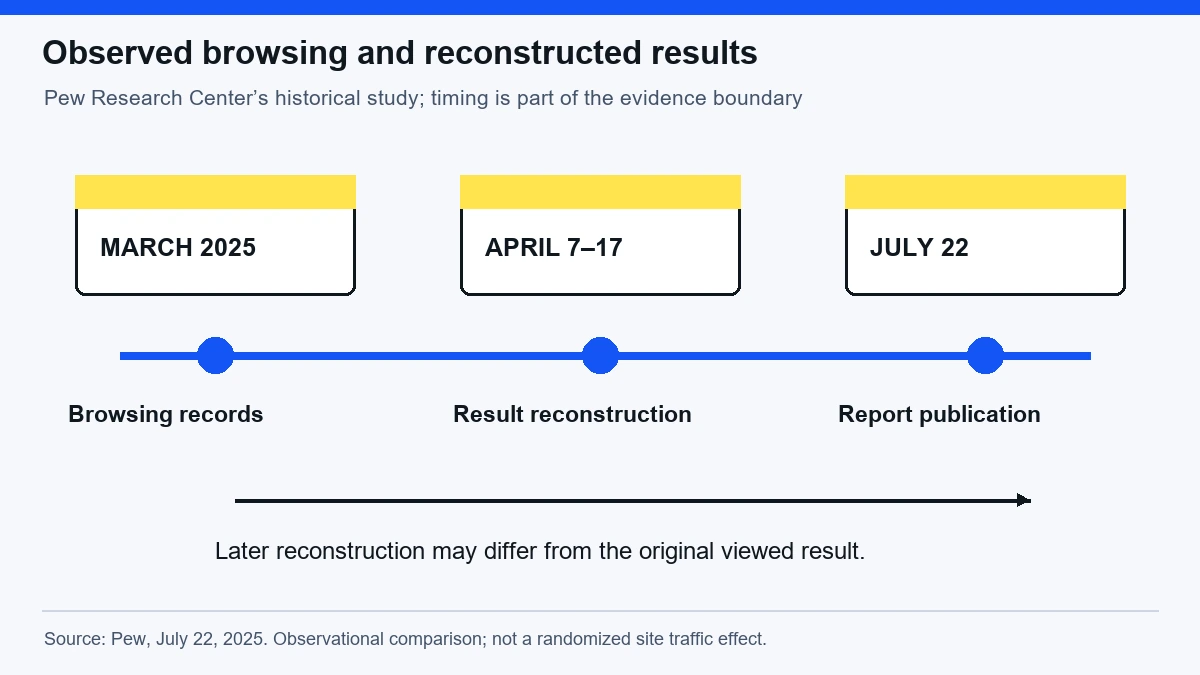
Pew used browsing data from 900 U.S. adults for March 2025 and later reconstructed search results for their queries during April 7–17. The analysis reported traditional-result clicks on 8% of visits with an AI summary and 15% without one. The source also explains that summaries can change over time, making the reconstruction timing material to interpretation. This article treats those numbers as historical observations, not current rates for November 2026. Pew’s primary report and methodology explanation.
The arithmetic difference is seven percentage points. Relative to 15%, 8% is about 46.7% lower. Neither calculation establishes that summaries caused every part of the difference. The groups may differ in query purpose, complexity, wording, user circumstances, and other factors associated with both summary appearance and clicking. The distinction between observed association and an intervention effect is central to responsible use of the study.
The denominator is a visit, not your impression
The reported percentages describe visits in the analysis, using its definitions. A publisher’s Search Console click-through rate has a different denominator: the publisher’s counted impressions under that reporting system. A user can see a search page without generating an impression for a specific site. The two measures cannot be exchanged simply because both are called click rates.
Consider a hypothetical publisher that appears in only one fifth of the search visits relevant to a broad topic. An eight-percent visit-level clicking figure does not mean eight percent of that publisher’s impressions will become clicks. It says nothing directly about where the publisher ranked, whether its result was visible, or which competing destinations attracted the click.
Likewise, a visit ending without an external click is not automatically an unsatisfied user or a lost publisher customer. The user may have learned enough, changed tasks, continued searching later, or used another route. Those possibilities do not make the publisher’s traffic concern unimportant. They explain why the business outcome needs its own measurement rather than being inferred from the absence of one event.
Write the numerator and denominator in ordinary words beside every chart. “Visits leading to a traditional result click divided by observed search visits” is different from “clicks to our site divided by our impressions.” This small documentation step prevents a later presentation from blending incompatible measures into a persuasive but meaningless trend.
Exposure measurement has a timing boundary
The browsing records and reconstructed results were collected on different schedules. A later reconstruction can provide useful information about the search environment, but it cannot guarantee that each user saw exactly that later result. The source explicitly notes that AI summaries may change. A careful interpretation retains this uncertainty rather than treating reconstructed exposure as a perfect recording of the original screen.
For an internal study, record the actual result page where authorized and practical, with time, locale, device context, and query. If only a later reconstruction is available, label it. A reconstructed result can answer a different question from a contemporaneous observation, and both can be useful when their limitations are clear.
Changing result pages also complicates repeated measurements. If the same query triggers a summary on one day and none the next, a single screenshot should not define its permanent exposure status. Use an observation schedule suited to the research question and preserve mixed cases. Forcing every query into a timeless yes-or-no category discards meaningful variation.
Do not equate missing exposure evidence with evidence of no exposure. A failed screenshot, unavailable result, or unrecorded session is a gap. It should remain a separate status in the dataset. Treating all gaps as “no AI summary” can bias the comparison while making the resulting spreadsheet look complete.
Query mix can create an aggregate difference
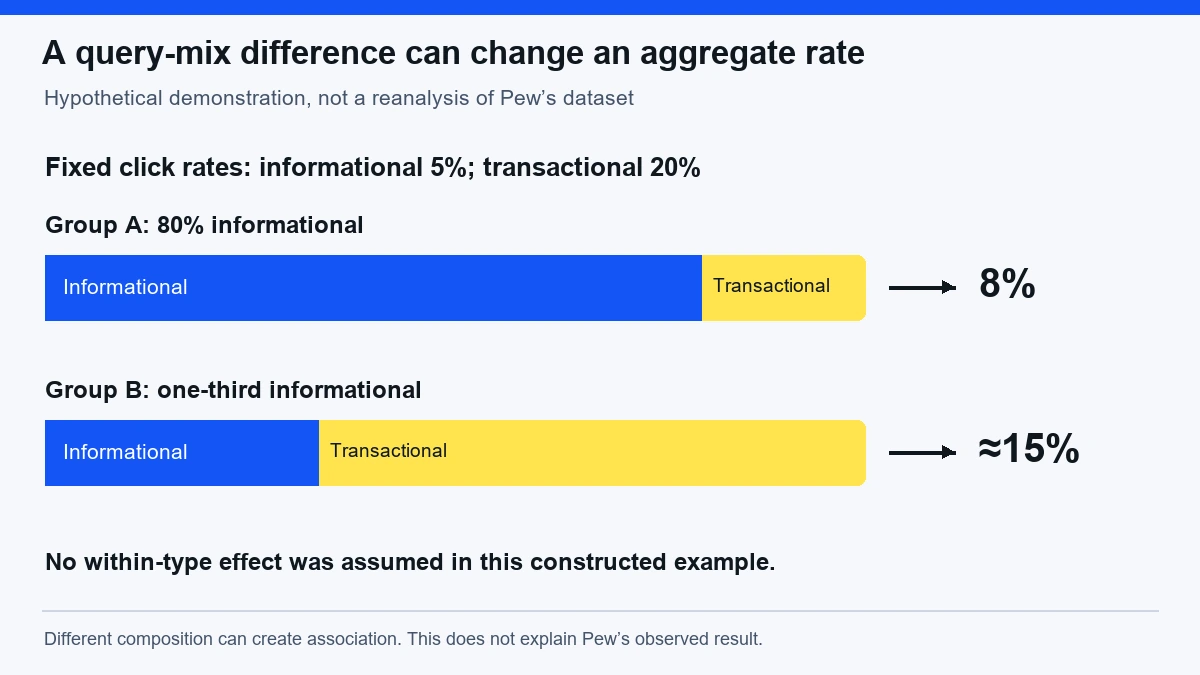
Here is a deliberately simplified illustrative example, not a reanalysis of Pew’s data. Suppose informational queries have a 5% click rate and transactional queries a 20% rate, with those rates identical whether a summary appears or not. Imagine the summary group contains 80% informational and 20% transactional visits. Its aggregate rate is 0.8 times 5% plus 0.2 times 20%, or 8%.
Now imagine the group without summaries contains one third informational and two thirds transactional visits. Its aggregate rate is approximately 15%. The aggregate difference resembles the headline comparison even though this constructed example contains no within-type summary effect. The example demonstrates a possible confounding mechanism; it does not establish that this mechanism explains Pew’s observed result.
The remedy is to examine comparable groups and report the limits that remain. Query intent, brand terms, device, geography, ranking position, and topic can help describe composition. A category label is not a magic causal adjustment: “informational” contains many different tasks, and unmeasured differences can persist within a category.
For a publisher, this means a site dominated by product comparisons should not automatically borrow an aggregate estimate from a broader search population. Its addressable queries, result formats, and reasons to click can differ. Segmenting the site makes the forecast more useful, even when the available data cannot support a definitive causal claim.
Build scenarios from the site outward
Start with an inventory of landing pages and query families that matter commercially. Separate branded navigation, quick factual questions, complex explanations, comparisons, and transaction preparation where the distinctions are useful. Record current clicks, impressions, conversion outcomes, and known data gaps. Use observed site data where available and label assumptions where it is absent.
Construct scenarios for the fraction of relevant exposure associated with an AI feature and for the possible change in click behavior within that exposure. Keep those as separate inputs. One assumption concerns how often the environment occurs; the other concerns what happens under it. Combining them into one unexplained adjustment makes sensitivity analysis difficult.
For example, suppose a hypothetical segment currently earns 10,000 monthly visits. A planning scenario assumes that 30% of its relevant opportunity is affected and that visits in that portion decline by 20%, with other conditions held constant. The implied reduction is 10,000 times 0.30 times 0.20, or 600 visits. This is scenario arithmetic, not an empirical prediction.
Change the assumptions to show the range. With 10% affected and a 10% decline, the implied reduction is 100 visits. With 50% affected and a 30% decline, it is 1,500. The wide range is useful because it reveals which uncertain inputs drive the decision. A precise-looking single forecast can conceal far more uncertainty than a transparent range.
Use search intent alignment to describe the tasks behind each segment instead of relying on a broad informational label alone.
Traffic and business value can move differently
A reduction in low-intent visits can have a different commercial effect from an equal reduction in qualified comparison visits. Track meaningful outcomes for each segment rather than assuming all sessions have equal value. A publisher funded by advertising may care strongly about page views; a specialist service business may care more about qualified inquiries and suitable opportunities.
Suppose a hypothetical informational segment loses 600 visits but historically generates one qualified inquiry per 1,000 visits. A comparison segment losing 100 visits at one inquiry per 50 visits could lose more inquiries. These simple calculations illustrate why prioritization should follow observed funnel behavior and its limitations, not traffic volume alone.
Attribution remains imperfect. A person may encounter an answer, remember the brand, and return directly later. A referral report may capture only part of that path. Do not solve the gap by assigning every unexplained direct conversion to AI exposure. Preserve measured referrals, customer-reported discovery, and unattributed outcomes as separate evidence streams.
Also inspect costs. A page that attracts fewer visits but still serves a valuable decision may remain worth maintaining. A large collection of thin pages with little qualified use may not. The study cannot settle those page-level investment choices because it does not contain the business’s production costs, customer economics, or content quality information.
The AI visibility mistakes guide offers a companion framework for keeping observed exposure separate from referrals and qualified outcomes.
Design a stronger internal observation program
Define the question before collecting data. “Did our organic traffic decline?” differs from “Did comparable queries show lower click rates when a summary was observed?” The first is an outcome trend. The second examines an association under a specific exposure definition. Neither automatically proves an intervention effect, but each can inform a different decision.
Save a fixed query panel and record additions separately. If the panel is refreshed only with queries where traffic has fallen, the observation program selects for negative outcomes. Keep topic, intent, market, device, and selection rationale with each query. Retain lost and unchanged queries so that the changing sample does not impersonate a changing ecosystem.
Compare equivalent time windows and account for known site changes, ranking changes, seasonality, and collection failures. If a redesign alters internal links during the study, note it. If a tracking script stops recording sessions, distinguish the measurement failure from a genuine visit decline. End-to-end troubleshooting protects the study from explanations chosen solely because they are topical.
Avoid treating every query-day or repeated screenshot as an independent affected opportunity. Repeated observations of one query share meaning and may share users or conditions. Report both the number of unique queries and the number of observations. This allows readers to understand whether a large dataset reflects broad coverage or frequent repetition of a narrow panel.
What the study should change in editorial planning
Use the research as a reason to examine which user tasks still need a visit. A basic definition may be fully answered in a result, while an interactive calculator, a detailed implementation procedure, or verified current availability may require deeper engagement. The right response is to create useful reasons to continue, rather than stretching simple answers into unnecessary text.
Do not hide the answer merely to force a click. A page should still satisfy the person who arrives. Add value through original evidence, worked calculations, clear decision criteria, complete limitations, and practical next steps. Those contributions can serve both readers and source evaluation without requiring a promise that any provider will reward the format.
For existing assets, prioritize the pages where a clearer decision tool would matter commercially. A disclosed cost model may be more useful than another generic introduction. A versioned compatibility table may resolve a support burden. The aggregate click study provides context for investment; the page’s actual reader problem determines the work.
For actionable source improvements after this forecasting exercise, consult the GEO implementation guide while preserving the scenario’s uncertain assumptions.
Questions for a research-aware forecast
Does the seven-point difference mean a site will lose seven percent of visits? No. Percentage points describe the difference between the reported rates. A site’s visit change depends on exposure, query composition, its own visibility, and other conditions. Applying seven points directly to total traffic confuses both the denominator and the mechanism.
Does an observational study have no value because it is not randomized? It has substantial descriptive value when its design and limits are retained. It can identify patterns worth investigating and challenge an assumption that search behavior is unchanged. The error is promoting an association into a precise causal promise about a different population.
Should a business abandon informational content? The study alone cannot justify that decision. Informational assets can support customer education, product adoption, brand familiarity, and later decisions. Evaluate their costs and observed contributions. Some should be improved, consolidated, or retired; others may remain essential even when direct clicks become harder to earn.
What should appear in an executive report? Include the historical source finding, the site’s own observed trend, the scenario assumptions, the affected segments, and the next investigation. Keep those layers visibly separate. A reader should know which number came from Pew, which came from the site, and which exists only as a planning assumption.
Keep the original estimate visible
When a later internal analysis adds new evidence, preserve the historical source finding in its original scope. Do not silently relabel Pew’s observation as a result from the publisher’s own customers or current market. A research register should retain source date, population, definition, and the reason the finding was considered relevant. This makes future revisions easier and prevents a planning assumption from becoming a supposed measured fact through repetition.
Site-scenario worksheet
These scenarios use a hypothetical 10,000 monthly-visit segment. They are planning arithmetic, not Pew findings or a forecast from an executed site study.
| Scenario | Assumed affected share | Assumed decline within that share | Implied visit reduction |
|---|---|---|---|
| Lower exposure assumption | 10% | 10% | 100 |
| Middle assumption | 30% | 20% | 600 |
| Higher exposure assumption | 50% | 30% | 1,500 |
| Study-reading field | Pew source scope | Internal-analysis requirement |
|---|---|---|
| Population and period | 900 U.S. adults,browsing March 2025 | State the site’s own audience and observation window |
| Exposure reconstruction | Results collected April 7–17, 2025 | Distinguish contemporaneous capture from later reconstruction |
| Click comparison | 8% versus 15% of studied visits | Do not substitute publisher impressions as denominator |
| Causal interpretation | Observational association | Examine query mix and remaining confounding |
| Business outcome | Not the site’s own revenue study | Measure qualified outcomes separately from scenarios |