
The Search Brief · News analysis
GA4’s AI Assistant Channel: How to Measure ChatGPT Traffic Without Breaking Your Acquisition Reports
Measure GA4’s AI Assistant channel with source reconciliation, reliable lead tracking and clear boundaries between assistant visits, citations and revenue.
Development covered: Primary-source guidance checked November 2, 2026

The AI Assistant channel gives marketers a clearer place to measure visits from recognized assistant sources, but it does not measure every interaction with an AI answer. The useful implementation starts by separating three things: the channel assigned to a session, the source that brought the visitor, and the business outcome recorded later. An assistant citation, a visit, and a qualified lead belong to different records.
Google’s current default-channel documentation explicitly lists an AI Assistant channel. It includes traffic from sources such as ChatGPT, Gemini, Deepseek, Copilot and Grok, while excluding Google AI Overviews and AI Mode. Those Google experiences belong to Organic Search under the documented taxonomy. The rule table also explains that recognized assistant referrers can cause the medium to be set to ai-assistant and the campaign to (ai-assistant). These are current documented rules, rather than a promise about what every historical property report contains. Google Analytics channel definitions.
That distinction changes the reporting job. A legacy report that searches only Referral for assistant domains can undercount visits now assigned elsewhere. A report that labels every Organic Search session as an AI visit will overstate what it knows. Build a small reconciliation before using the AI Assistant channel in a management dashboard.
Start with the business question and the reporting scope
A useful question is, “How many recognized assistant acquisition sessions reached our pricing or consultation pages, and how many produced qualified inquiries?” That question can be answered from acquisition records plus an agreed qualification process. “How much revenue did AI influence?” is broader. It requires assumptions about earlier exposure, later visits and attribution that a channel row cannot settle.
Choose session-scoped dimensions when comparing the sources that started visits. Choose first-user dimensions when studying how people were initially acquired. Choose event-scoped attribution when discussing credit assigned to key events. Mixing those scopes in one sentence creates misleading arithmetic even when every number is copied correctly. Google’s documentation distinguishes these scopes and their attribution behavior in its channel table. Traffic-source scopes.
For example, a visitor can first discover a business through an assistant, return through a saved bookmark and submit an inquiry. The first acquisition source, the source of the return session and the attributed source of the inquiry may differ. None of those observations automatically contradicts the others. The analyst must name the question being answered and use the corresponding scope throughout the calculation; use the complete SEO audit framework to place collection checks in the wider measurement path.
Write a reporting contract before building charts. Include property, timezone, date range, session definition, channel dimension, conversion event, qualification rule and maturity window. “Qualified inquiry” might mean a unique submission accepted by sales within fourteen days. Record that rule so a month with faster qualification does not appear to outperform a month whose leads remain unreviewed.
Inspect the underlying source rows
First examine the AI Assistant channel with session source and session medium. Then inspect known assistant source domains across all channels, rather than presuming their current classification. Look for rows that appear in both your legacy grouping and the documented channel. The purpose is to understand the transition in your own data, not to override a platform classification because an older dashboard expected another label.
Keep the source table. A single channel total hides changes in composition. More traffic from one assistant can offset a decline from another, and the resulting total can look stable while landing-page demand changes substantially. Source-level rows also reveal spelling, hostname and tracking changes that would be difficult to diagnose from a blended metric.
Do not classify a visit from the page text the visitor read. A landing page about ChatGPT is not evidence of an assistant referral. Similarly, a browser user agent containing a familiar brand name does not prove that a human session came from that assistant. Acquisition classification should follow observed source information and clearly documented rules.
Treat direct and unknown traffic as unknown where source evidence is absent. It may include people influenced by assistants, but assigning all of it to AI would turn a possibility into a measured result. Maintain a separate survey or qualitative attribution field if customers can describe discovery in their own words. That field supplements the acquisition record; it should not silently rewrite it.
A worked reconciliation with realistic boundaries
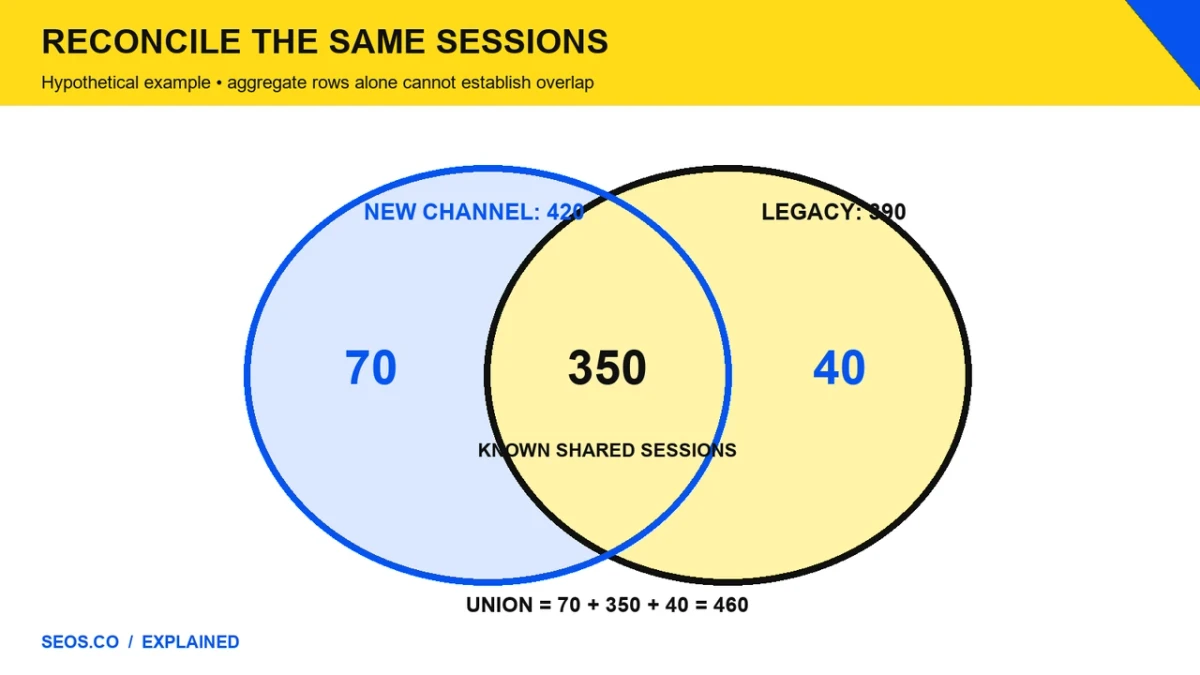
Consider an entirely hypothetical B2B site reviewing one settled month. Its new report contains 420 AI Assistant sessions. A legacy domain-based report contains 390 sessions labeled as assistant referrals. Inspection finds 350 sessions in both sets, 70 appearing only in the new channel definition, and 40 appearing only in the legacy classification.
This intersection is assumed known in the hypothetical example. Aggregate channel exports alone do not identify the same individual sessions across two classifications. A real union requires an appropriate session-level reconciliation or another validated way to establish overlap; if that evidence is unavailable, report the two totals and an unresolved overlap rather than calculating a supposedly observed union. The combined illustrative set contains 460 distinct sessions: 350 shared, plus 70 new-only, plus 40 legacy-only. Adding the headline totals, 420 plus 390, would produce 810 and double-count the shared sessions. Taking the larger total, 420, would hide forty records whose discrepancy still requires explanation. The reconciliation should preserve the intersection and both differences.
The seventy new-only sessions might involve newly recognized sources or changed medium rules. The forty legacy-only sessions might involve an outdated custom pattern, manually tagged traffic, unrecognized referrers or a different date filter. Those are hypotheses to test against the actual rows. The arithmetic does not identify their cause. Preserve the raw export before changing a grouping, so the team can reproduce the investigation.
Suppose the 420 channel sessions generated twelve form submissions. Two are duplicates, three fail the sales qualification rule, and one remains pending. There are six confirmed qualified inquiries, not twelve. The current qualified-inquiry rate is six divided by 420, or approximately 1.43%. The pending inquiry remains pending; it should not be counted as a rejection just to close the month.
If the pending inquiry later qualifies, the mature rate becomes seven divided by 420, or approximately 1.67%. Store both the reporting date and the qualification cutoff. A dashboard can then show provisional and mature cohorts instead of repeatedly changing historical rates without explanation. This distinction is especially useful when the number of assistant leads is small enough that one decision materially changes the percentage.
Build the report in layers
The acquisition layer should show sessions, landing pages and source composition. The engagement layer should show whether visitors reached the intended next step. The business layer should show unique qualified inquiries, opportunities and realized margin when those outcomes become available. Keep the layers connected through permitted identifiers and aggregate checks, while minimizing unnecessary personal information.
A practical landing-page table includes category, assistant source, sessions, consultation starts, successful submissions, qualified inquiries and pending inquiries. Include an error indicator if the consultation form failed during the period. A low submission rate means something different when the form was broken. Without that operational context, a content team can be blamed for a conversion problem outside its work.
Use stable page groups. If URL parameters create multiple versions of the same destination, decide how the report normalizes them and preserve the original URL in an audit field. Otherwise a campaign parameter can make a successful page appear to be three small pages, masking its contribution and making month-to-month comparisons unnecessarily noisy.
Keep recognized assistant visits and manually classified possible assistant visits separate until the classification is validated. A supplementary view can be useful, but its label must reveal that it follows your custom rules. Document the exact inclusion logic, the date introduced and whether historical data was recalculated. A broad custom expression should never quietly become the organization’s definition of measured AI demand.
Verify collection before interpreting performance
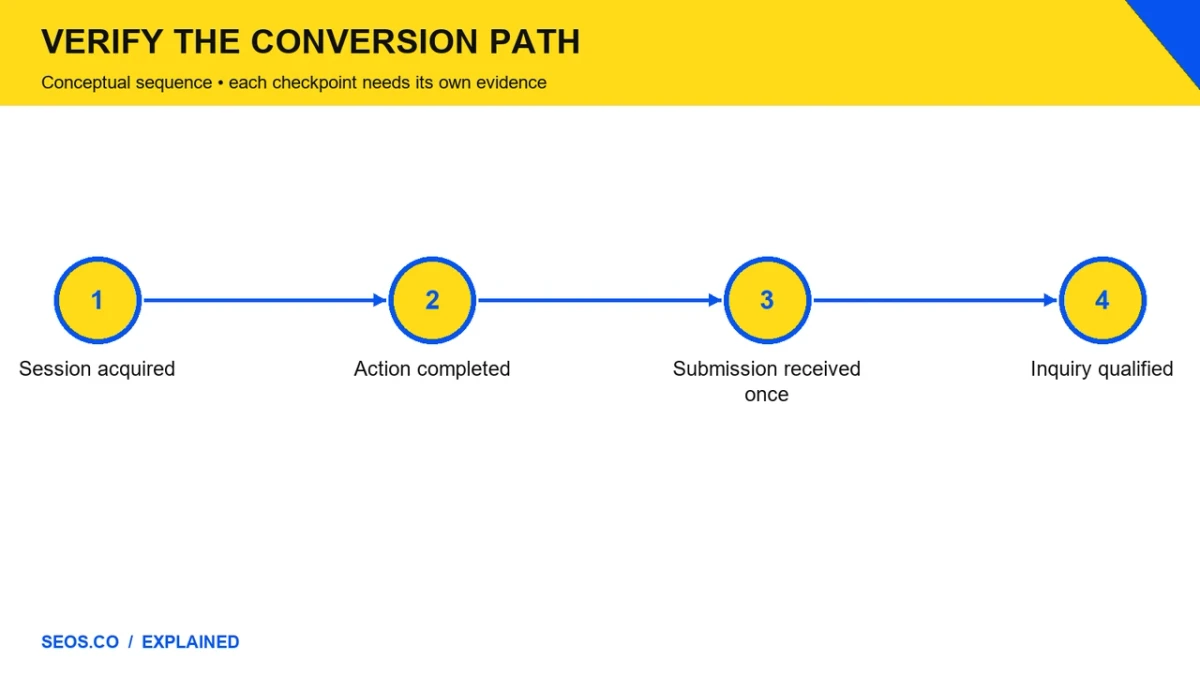
A report can contain plausible numbers while collection is incomplete. Test the actual visitor path on representative devices and consent states. Confirm that the landing page loads, the expected session information survives navigation, the main action can be completed and the successful submission reaches the business system once. Treat those as different checkpoints.
A front-end success message alone is insufficient evidence of a received lead. Confirm the record in the destination system, check duplicate prevention and compare submission timestamps with event timestamps. If a submission generates two browser events or a retry creates two customer records, the apparent conversion rate can be inflated. Conversely, an event can be missing even when the business received the inquiry.
Test redirects and subdomain transitions where they exist. An assistant link might reach an old URL before redirecting to a new page. A consultation flow might move to a booking provider. Record what source information is observable at each step. Do not guess that a source changed because of a redirect; inspect a reproducible path and its permitted debugging evidence.
When collection differs by consent state, report the measurement boundary. The goal is to understand the observed population, not to defeat visitors’ choices. Compare changes under equivalent conditions and avoid treating modeled, observed and unknown records as interchangeable. A data-quality note is most useful when it names the affected step and likely direction of bias.
Diagnose a sudden change in the AI Assistant channel
Begin with the numerator and denominator separately. Did recognized sessions change, did the share of all acquisition change, or did both move? A rising share can result from falling traffic elsewhere. A falling qualified-inquiry rate can result from an influx of informational visits while the absolute number of useful inquiries grows. Use the content SEO measurement framework to connect page purpose with outcomes. Show counts alongside rates so the interpretation remains grounded.
Next inspect source mix and landing-page mix. If one assistant suddenly contributes more article visits, the blended conversion rate may fall without any page becoming less effective. Compare like pages and like tasks. A glossary visit and a pricing comparison visit should not be expected to produce the same immediate action.
Then examine classification, collection and reporting changes. Record when a custom channel group was edited, a consent configuration changed, a form was replaced or an analytics implementation was released. Compare the change timestamp with the first affected records. A channel break caused by measurement should be repaired as measurement; it should not prompt a speculative rewrite of every article.
Finally examine actual acquisition conditions. Check whether the relevant pages remain available, whether assistant answers cite them in the specific tested questions and whether there is a genuine content or offer change. A small prompt panel cannot prove the source of every session change, but it can provide useful corroborating evidence. Keep those observations separate from the analytics totals.
Report trends without manufacturing historical comparability
If the channel taxonomy changed during the comparison window, show a visible break in series or provide a reconciled historical view with its limitations. Do not plot the new channel against an older empty row and describe the increase as organic growth. The new label might simply make previously grouped traffic easier to see.
A normalized report should disclose which sources were classified consistently across both periods. If one source can be identified only in the newer period, either exclude it from the comparable subset or show it as an additional segment. Both approaches are more honest than pretending the historical universe was identical.
Use a maturity schedule for business outcomes. For example, close acquisition sessions promptly but allow lead qualification to settle before comparing conversion cohorts. Continue showing pending records rather than deleting them from the denominator. A simple status table often explains more than a complicated attribution model when an organization has only a few dozen assistant leads.
Questions the channel can answer—and questions requiring other evidence
Can the AI Assistant channel show whether recognized assistant visitors convert? Yes, within the property’s collection and attribution boundaries, provided the outcome event is reliable and the scope is named. It is useful for acquisition analysis and can support landing-page decisions when there is enough comparable data.
Can it show how often a brand was cited without a click? No. That requires a separate answer-observation process or a provider report designed for citations. A source can be cited without producing a visit, and a visitor can arrive after reading an uncited brand mention. Neither relationship is recoverable from a session count alone.
Can it prove that a GEO content change caused additional sales? No. A causal claim needs a suitable comparison and consideration of simultaneous changes. The channel can be an outcome in an experiment, but its existence does not supply the experiment’s design. Keep measured acquisition, observed answer visibility and inferred influence as separate evidence types.
The immediate next step is a one-page reconciliation: current channel totals, source rows, legacy differences, verified business outcomes and named gaps. Once that record is stable, the AI Assistant channel becomes a useful management instrument. Its value comes from a clear measurement contract and confirmed outcomes, rather than from treating a new label as a complete view of AI discovery.
Preserve a reproducible reconciliation
Save the source-row export, channel-rule version and qualification cutoff with the report. A future analyst should be able to distinguish a taxonomy change from a real acquisition change without reconstructing the month from memory. Include unresolved differences in a bounded exception table with counts and the likely affected metric. A later correction can update the relevant cohort with a visible note rather than silently rewriting the historical story.
Build the report with explicit dimensions and metrics
Start in the Traffic acquisition report and use Session default channel group for the acquisition classification. Add Session source / medium as a secondary breakdown where the report configuration supports it. Keep the date range and filters identical when comparing the assistant channel with source-level rows. Select Sessions as the acquisition denominator and the intended key event as the outcome, then verify that the event represents a received action rather than an unconfirmed button click.
For landing-page analysis, create a separate exploration or report using Landing page with the same session acquisition dimensions and filters. Include Sessions, the selected key-event count and any available unique business-outcome reconciliation outside the analytics report. Check dimension and metric compatibility in the property rather than forcing an unsupported combination into one table. Do not confuse event counts with unique qualified leads or join aggregated tables as though their rows identify individual sessions. Google Traffic acquisition report.