
The Search Brief · News analysis
Original Research Content: Publish a Method Readers Can Inspect
Plan credible original research with defined samples, coding rules, missing-data sensitivity and transparent charts, illustrated by a fictional pricing audit.
Development covered: Primary-source guidance checked November 2, 2026

Original research content earns credibility when readers can understand what was observed, how the observations were selected and what the results can legitimately support. A proprietary spreadsheet is not automatically a study, and a large count does not repair a biased sample. Begin with a clear question, define the population and observation unit, then publish enough method to make the headline assessable.
A useful research article can be modest. It might describe an audit of a defined set of pages, a carefully documented customer survey or a benchmark under controlled conditions. Its value comes from reliable observation and transparent reasoning, not from using the word study in a title. When the data supports only a bounded description, keep the conclusion bounded.
The audit example below is entirely hypothetical. Its numbers teach sampling and denominator choices; they are not SEOS.co findings or a claim about the web. The method is intended for editorial teams planning first-party research before any collection begins.
Define the question and the population separately
A question such as “How often do pricing pages explain implementation costs?” needs a target population. Is the study about a named industry, a country, a company size band or the first results returned by a particular search? Those choices determine what the evidence can describe.
Define the unit of observation. A company, a domain, a page and a price-plan row are different units. If one company contributes ten pages and another contributes one, a page-level percentage can overweight the first company. The study must say which unit belongs in the denominator and why.
Specify the time frame and relevant conditions. A page can change during collection. A regional price can differ from a global page. Record collection dates, locale and any login or access conditions that affect the observation. Without them, another reader may inspect a different representation and reasonably question the result.
Use the search-intent guide to connect the research question to a real decision. An audit should answer something readers need to know, rather than collect whichever field is easiest and build a headline afterward.
Choose a sample without disguising its limits
A probability sample and a convenience sample support different kinds of inference. A list assembled from familiar companies or visible search results may still be useful, but it should not be described as representative of an entire industry without a defensible basis. State how the list was constructed.
Search-result sampling has specific limitations. The selected sites depend on query, engine, date, location and result depth. It can describe that defined set of results, not every business offering the service. Preserve the collection query and the inclusion rule rather than retroactively describing the sample as market leaders.
Avoid selecting only accessible or well-designed pages without reporting exclusions. A site that blocks collection or lacks a public price can be relevant to the question. Record missingness and exclusion reasons so readers can see whether the observed set differs systematically from the intended sample.
If several sources build the sample, deduplicate at the chosen unit. A company appearing in three directories should not become three companies. Preserve the original source memberships for audit while assigning one stable entity identifier to the analysis record.
Write the coding rule before collecting the result
Define what counts as explaining implementation costs. Does a statement that setup is available qualify? Does the page need a price, range, inclusion statement or named cost factors? A vague definition invites inconsistent coding and makes the headline difficult to interpret.
Create a small codebook with positive, negative and ambiguous examples. For instance, “onboarding included in the annual plan” might satisfy an inclusion criterion, while “contact us for more information” may not. The rule should follow the reader’s decision rather than favor whichever companies the researcher expects to perform well.
Keep factual observation separate from evaluative judgment. A field can record whether a setup fee is visible. Another can assess whether the explanation is sufficient for initial comparison. The second requires a defined standard and may involve more reviewer interpretation. Do not present it as a purely mechanical fact.
Pilot the rule on a small set and resolve ambiguity before scaling. Preserve the pilot changes and freeze the final coding version for the main collection. If the definition changes later, recode the affected records or clearly separate versions. Mixing standards can produce a percentage that has no stable meaning.
Work through a hypothetical denominator
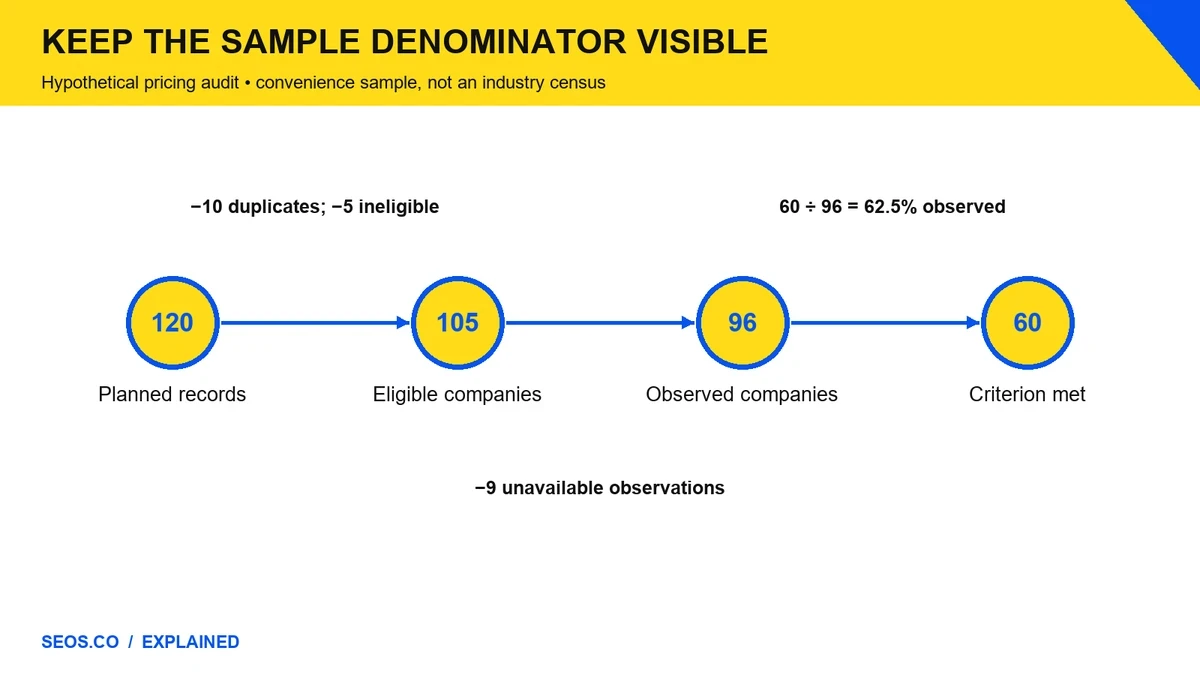
Imagine a planned audit of 120 software companies selected under a documented convenience-sample rule. Ten are duplicates and five fall outside the defined market, leaving 105 eligible companies. Of those, nine pages cannot be inspected under the collection conditions, leaving 96 observed companies.
Suppose 60 of the 96 observed companies explicitly state whether implementation is included or separately charged. The observed proportion is 60 divided by 96, or 62.5%. Dividing 60 by 120 would answer a different question because the original list contained duplicates and ineligible entries. Dividing by 105 would combine observed and unavailable records without explaining their treatment.
| Hypothetical sample stage | Count | Meaning |
|---|---|---|
| Planned list | 120 | Starting convenience-sample records |
| Duplicate records removed | 10 | Do not count the same company twice |
| Out-of-market records removed | 5 | Outside the defined population |
| Eligible companies | 105 | Intended eligible analysis set |
| Unavailable observations | 9 | Missing outcomes, not negative codes |
| Observed companies | 96 | Denominator for the observed proportion |
| Criterion met | 60 | Numerator; 60 ÷ 96 = 62.5% |
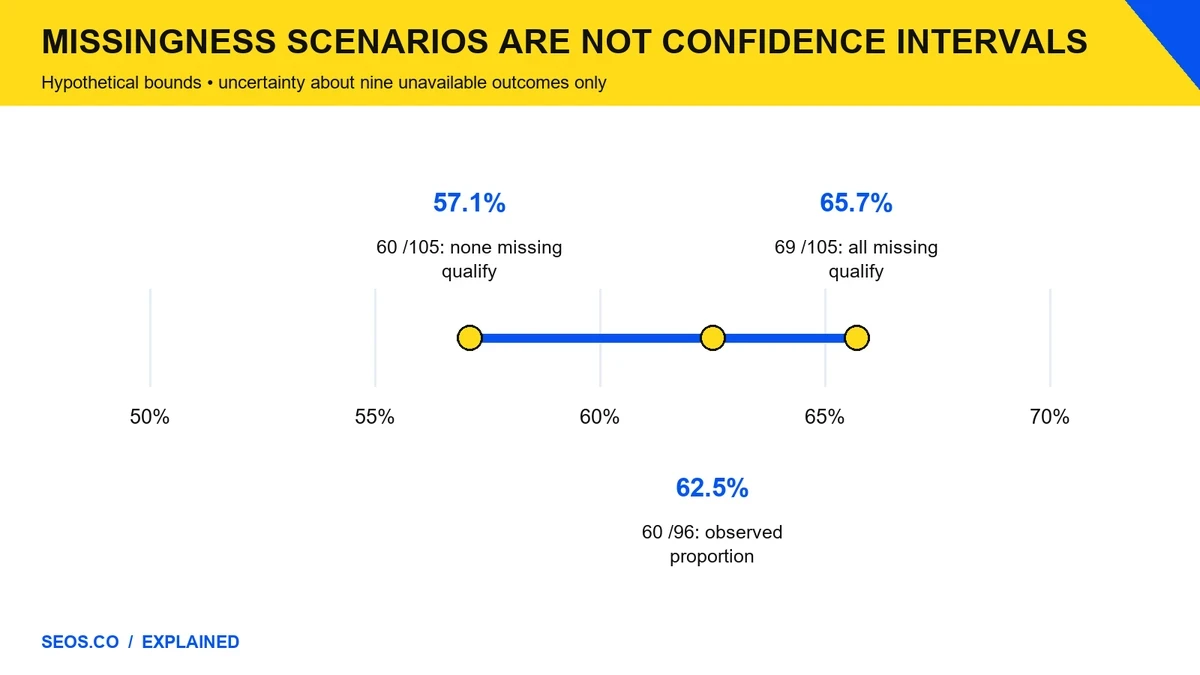
The nine unavailable records create uncertainty. If none would satisfy the criterion, the eligible-set proportion would be 60/105, approximately 57.1%. If all nine would satisfy it, the proportion would be 69/105, approximately 65.7%. This simple sensitivity range describes missing-outcome possibilities; it is not a confidence interval or a correction for sample selection bias.
The headline should therefore describe the observed sample and criterion. It should not claim that 62.5% of all software companies behave that way. The number becomes more useful when the reader can inspect the sample construction, coding rule and missingness rather than relying on the apparent authority of a precise percentage.
Keep evidence for every coded record
Store URL, observed date, relevant passage or screenshot reference, code, reviewer and uncertainty note. The evidence should establish the field actually measured. A page title containing pricing does not prove that implementation costs were explained.
Preserve the original observation when the page later changes. A current contradiction does not automatically mean the earlier coding was wrong. The research record should show what was observed at the stated time. Use retention and permissions appropriate to the material rather than copying entire sites unnecessarily.
For automated extraction, validate representative outputs and known difficult cases. A parser can miss a cost condition inside an accessible expansion panel or combine unrelated currency values. Record the extraction method and manual verification boundary. A successful script run is not a factual review of every field.
Treat failed collection as a state with a reason. Timeout, blocked access, missing page and unsupported format are not equivalent to a negative coding result. If one slow task prevents other observations from completing, the collection process needs repair before the missing records are interpreted.
Use independent review where it matters
Have a second reviewer code a defined subset or all consequential ambiguous cases where resources permit. Compare disagreements and their reasons. The purpose is to identify inconsistent interpretation, not to manufacture a high agreement statistic by selecting only easy records.
Adjudicate against the codebook and source evidence. If the rule itself is unclear, revise it and assess affected earlier records. Keep the version history. A study can improve during a pilot, but its final report should not pretend the original process was flawless.
If independent coding is unavailable, disclose the single-reviewer limitation and preserve inspectable evidence. Do not label a model’s second pass independent human review. Automated assistance can help triage inconsistency, but its role should be described accurately.
The AI-assisted content quality guide provides relevant editorial context. Models can structure records and suggest checks, while the publication remains accountable for the observation, claim and evidence boundary.
Publish a method that matches the claim
The methods section should identify sponsor, research question, population, sample source, inclusion rules, field dates, observation unit, collection method, coding definitions, missingness and analysis procedure. Include the limitations that could change interpretation, not a generic sentence saying all research has limits.
AAPOR’s Transparency Initiative emphasizes disclosure of key methodological information for survey and public-opinion research. Its standards are specific to those research contexts, but the general editorial lesson is useful: readers need enough information to evaluate how findings were produced. Do not claim certification or membership merely because your article follows a transparent approach. AAPOR Transparency Initiative.
For a web audit, publish the additional details its own design requires, such as query-based sampling, page variants and coding examples. For a survey, disclose recruitment and question wording. For a performance benchmark, disclose environment, workload and measurement conditions. One universal methods template cannot replace design-specific explanation.
Provide a calculation example or downloadable aggregate table when useful and permitted. Remove personal or confidential information and avoid implying that unavailable raw data was publicly released. A reproducible summary can still be valuable when full record publication is inappropriate, provided the access boundary is clear.
Make the charts tell the same story as the method
Use counts and denominators in labels. A chart showing 62.5% should identify 96 observed companies and the criterion measured. Show unavailable or excluded records separately rather than allowing them to disappear. The sample-flow diagram often explains the result more clearly than a dramatic percentage graphic.
Distinguish uncertainty types. A missingness sensitivity range, a model scenario and a statistical confidence interval are different objects. Label them accurately. Do not add error bars simply because they make the chart look scientific, and do not omit important uncertainty because it weakens a headline.
Avoid causal language for a descriptive audit. If pages with clearer cost information also attract more inquiries, that association does not establish that the explanation caused the difference. Company size, offer, demand and measurement can differ. A separate design would be needed for a causal question.
The content SEO guide helps connect the research asset to reader utility. A strong chart should answer the stated decision and lead naturally to the underlying evidence, rather than become a decorative shareable statistic detached from the method.
Plan distribution without inflating the conclusion
Write a headline that names the population actually observed. A qualified title can still be interesting when the question matters. Overgeneralization may create short-term attention while making the asset harder to defend or cite responsibly.
Prepare a short findings summary, a method link and clear reuse guidance. If another publisher cites the result, the denominator and date should travel with it. Correct material misinterpretations through appropriate channels without inventing a broader claim to fit the coverage.
Connect the article to useful existing resources. A pricing audit can link to cost-planning guidance, while a research-method article can support later study analyses. The internal linking checklist helps implement those paths as meaningful navigation rather than indiscriminate links.
Preserve corrections and future comparability
If a coding error is discovered, assess its effect on the result and correct the article visibly. Preserve the original record and the reason for revision. A transparent correction can strengthen the research process; hiding the change makes later comparisons and citations unreliable.
A repeat study needs stable definitions or a bridge explaining changes. If the sample source, criterion or collection conditions change, do not automatically describe the difference as a market trend. Separate comparable records from newly added coverage and state what can be inferred.
Original research is strongest when the reader can challenge it intelligently. A clear population, defensible unit, inspectable method and honest limitation make that possible. The result may be narrower than an ambitious headline, but it becomes a reliable contribution that other people can use without inheriting an unsupported claim.
Freeze an analysis plan before the headline emerges
Write the primary outcome, denominator, exclusions and intended comparisons before inspecting the full result. This reduces the temptation to search many fields and promote whichever difference looks most dramatic. Exploratory findings can still be useful, but they should be labeled as exploratory and tested again where the decision warrants it.
Specify how multiple pages from one company will be handled. If the company is the unit, define which page supplies the observation or how conflicting pages are coded. If pages are the unit, report that larger sites may contribute more observations. A large record count does not eliminate clustering or make the observations independent companies.
Keep a simple analysis log. Record corrections, changed definitions and sensitivity views with reasons. A data-cleaning decision that removes duplicates is different from excluding a company because its result is inconvenient. The log lets a reviewer distinguish legitimate repair from selective analysis without assuming that every change is improper.
Before release, ask a reviewer to reproduce the headline calculation from the published aggregate table. They should reach the same numerator, denominator and rounding. Then ask what conclusion the calculation cannot support. This two-part check verifies arithmetic and inference separately, which is more useful than a source-count quota or a polished methodology badge.